| Mr. Casellas served as the Chairman of OMNITRU (a consulting and investment firm) from 2011 to 2017. He was the VP, Corporate Responsibility, of Dell Inc. (a global computer manufacturer) from 2007 to 2010. He served as a Member of Mintz Levin Cohn Ferris Glovsky & Popeo, PC from June 2005 to October 2007. He was the President of Casellas & Associates, LLC (a consulting firm) from 2001 to 2005. During 2001, he served as President and CEO ofQ-linx, Inc. and served as the President and COO of The Swarthmore Group, Inc. from January 1999 to December 2000. Mr. Casellas served as Chairman, U.S. EEOC from 1994 to 1998, and General Counsel, U.S. Department of the Air Force, from 1993 to 1994. | | Skills & Qualifications | | | • Business Ethics • Business Head/Administration • Business Operations • Corporate Governance • Environmental/Sustainability/Corporate Responsibility • Government/Public Policy • Investments | | • Risk Management • Talent Management |
| | | | | | | | | | | | | |  | | Mark B. Grier
Age:64
Director Since:January 2008 
| | Prudential Committees:
Robert M. Falzon • None Age:59
To be elected as a Director:August 2019 | | | | | | | | | | | | | | | |
Mr. Grier has served as Vice Chairman since 2007 and a member of the Office of the Chairman of Prudential Financial since August 2002. From April 2007 through January 2008, he served as Vice Chairman overseeing the International Insurance and Investments divisions and Global Marketing and Communications. Mr. Grier was Chief Financial Officer (CFO) of Prudential Insurance from 1995 to 1997 and has served in various executive roles. Prior to joining Prudential, Mr. Grier was an executive with Chase Manhattan Corporation.
| | | | | Mr. Falzon was elected Vice Chairman of Prudential Financial in December 2018. Previously, he served as Executive Vice President and CFO of Prudential Financial from 2013 to 2018, and has been a member of the Company’s Executive Leadership Team since 2013. Mr. Falzon also served as Senior Vice President and Treasurer of Prudential Financial from 2010 to 2013. Mr. Falzon has been with Prudential since 1983, serving in various positions including managing director at PGIM Real Estate (“PGIM RE”), head of PGIM RE’s Global Merchant Banking Group and CEO of its European business. He was also a Senior Portfolio Manager, a member of PGIM RE’s Global Investment and Management Committees, Chairman of the Global Real Estate Securities Investment Committee and the Currency Hedging Committee, and a member of the Investment Committee for Prudential Investment Management. | | Skills & Qualifications | | | • Business Ethics • Business Head/Administration • Business Operations • Corporate Governance • Environmental/Sustainability/Corporate Responsibility • Finance/Capital Allocation • Financial Services Industry • Government/Public Policy • Insurance Industry • International • Investments | | • Real Estate • Risk Management • Talent Management • Technology/Systems | | |
| | | | | | | | 12 | | | | | Notice of Annual Meeting of Shareholders and 2019 Proxy Statement |
| | | 
| | Item 1—Election of Directors:Director Nominees | |
| | | | | | | | |  | | Mark B. Grier Age:66 Director Since:January 2008 Mr. Grier is expected to retire from Prudential in August 2019 and will leave the Board at that time. | | Prudential Committees: • Risk | | | | | | | | | | | | | | | | | Mr. Grier has served as Vice Chairman of Prudential Financial since 2007 and a member of the Company’s Executive Leadership Team since 2002. Mr. Grier will be retiring from the Company no later than August 30, 2019 and will leave the Board at that time. Upon his retirement, it is expected that Robert Falzon’s service on the Board will commence. From April 2007 through January 2008, Mr. Grier served as Vice Chairman of Prudential Financial overseeing the International Insurance and Investments divisions and Global Marketing and Communications. Mr. Grier was CFO of Prudential Insurance from 1995 to 1997. Prior to joining Prudential, Mr. Grier was an executive with Chase Manhattan Corporation. | | Skills & Qualifications • Business Ethics • Business Head/Administration • Business Operations • Corporate Governance • Environmental/Sustainability/ Corporate Responsibility • Finance/Capital Allocation | | • Financial Services Industry • Government/Public Policy • Insurance Industry • International • Risk Management • Talent Management • Technology/Systems |
| | | | | | | | | |  | | | |  | | Martina Hund-Mejean Age:5658 Director Since:October 2010 | | Prudential Committees: • Audit | | | | | | | | | | | | | |
Ms. Hund-Mejean has served as the CFO and a member of the Executive Committee at MasterCard Worldwide (a global transaction processing and consulting services company) since 2007. Ms. Hund-Mejean served as Senior Vice President (SVP) and Corporate Treasurer at Tyco International Ltd. from 2003 to 2007; SVP and Treasurer at Lucent Technologies from 2000 to 2002; and held management positions at General Motors Company from 1988 to 2000. Ms. Hund-Mejean began her career as a credit analyst at Dow Chemical in Frankfurt, Germany.
| | | | | Ms. Hund-Mejean has served as the CFO and a member of the Executive Committee at Mastercard Worldwide (a global transaction processing and consulting services company) since 2007. She has announced her intention to step down as CFO of Mastercard Worldwide effective April 1, 2019. Ms. Hund-Mejean served as Senior Vice President (SVP) and Corporate Treasurer at Tyco International Ltd. from 2003 to 2007; SVP and Treasurer at Lucent Technologies from 2000 to 2002; and held management positions at General Motors Company from 1988 to 2000. Ms. Hund-Mejean began her career as a credit analyst at Dow Chemical in Frankfurt, Germany. | | Skills & Qualifications | | | • Business Head/Administration • Business Operations • Corporate Governance • Finance/Capital Allocation • Financial Services Industry • International • Investments | | • Risk Management • Talent Management |
• Technology/Systems | | | | | | | Notice of Annual Meeting of Shareholders and 2017 Proxy Statement | | | | 11 | |
| | |   | | Item 1—Election of Directors:Director Nominees
|
| | | | | | | | | | | | | |  | | Karl J. Krapek Age:6870 Director Since:January 2004 Lead Independent Director since May 2014
| | Prudential Committees: • Compensation (Chair) • Executive (Chair) • Risk (Chair) | | Public Directorships: Former Directorships Held During the Past Five Years:• Northrop Grumman
Corporation
• Visteon Corporation (June 2012) • The Connecticut Bank & Trust Company (April 2012)Pensare Acquisition Corp.
| | Public Directorships:
• Northrop Grumman Corporation
| | | | | | | | | | | |
Mr. Krapekserved as the President and COO of United Technologies Corporation (UTC) from 1999 until his retirement in January 2002. Prior to that time, Mr. Krapek held other management positions at UTC, which he joined in 1982. Mr. Krapek is also theco-founder of The Keystone Companies, which was founded in 2002 and develops residential and commercial real estate.
| | | | | Mr. Krapekserved as the President and COO of United Technologies Corporation (UTC) from 1999 until his retirement in January 2002. Prior to that time, Mr. Krapek held other management positions at UTC, which he joined in 1982. Mr. Krapek is also theco-founder of The Keystone Companies, which was founded in 2002 and develops residential and commercial real estate. | | Skills & Qualifications | | | • Business Head/Administration • Business Operations • Corporate Governance • Environmental/Sustainability/Corporate Responsibility • Finance/Capital Allocation • International • Real Estate | | • Risk Management • Talent Management • Technology/Systems | | |
| | | | | | | | Notice of Annual Meeting of Shareholders and 2019 Proxy Statement | | | | | 13 |
| | |
| | Item 1—Election of Directors:Director Nominees | |
| | | | | | | | | | | | | |  | | Peter R. Lighte Age:6870 Director Since:March 2016 | | Prudential Committees: • Corporate Governance and Business Ethics • Investment | | | | | | | | | | | | | |
Mr. Lighteserved as the Vice Chairman, J.P. Morgan Corporate Bank, China, from 2010 to 2014, and was the founding Chairman of J.P. Morgan Chase Bank China, from 2007 to 2010. Prior to that, he headed the Company’s International Client Coverage for Treasury and Securities Services in J.P. Morgan’s European Global Operating Services Division and was instrumental inre-establishing its corporate bank in London. Mr. Lighte previously served as the President of Chase Trust Bank in Tokyo from 2000 to 2002. He was also the founding representative in Beijing of Manufacturers Hanover Trust Company. Mr. Lighte has also taught at several academic institutions, including Middlebury College and the University of Santa Clara.
| | | | | Mr. Lighte served as the Vice Chairman, J.P. Morgan Corporate Bank, China (a global financial services company), from 2010 to 2014, and the founding Chairman of J.P. Morgan Chase Bank China, from 2007 to 2010. Prior to that, he headed the company’s International Client Coverage for Treasury and Securities Services in J.P. Morgan’s European Global Operating Services Division and was instrumental inre-establishing its corporate bank in London. Mr. Lighte previously served as the President of Chase Trust Bank in Tokyo from 2000 to 2002. He was also the founding representative in Beijing of Manufacturers Hanover Trust Company. Mr. Lighte has also taught at several academic institutions, including Middlebury College and the University of Santa Clara. | | Skills & Qualifications | | | • Academia/Education • Business Head/Administration • Business Operations • Corporate Governance • Finance/Capital Allocation • Financial Services Industry • Government/Public Policy | | • Insurance Industry • International • Investments • Risk Management • Talent Management | | |  | | Charles F. Lowrey Age:61 Director Since:December 2018 | | Prudential Committees: • Executive | | | | | | | | | | | | | | | | | | Mr. Lowrey was elected CEO and President of Prudential Financial and Prudential Insurance in December 2018. As of April 5, 2019, Mr. Lowrey will become the Chairman of the Board of Directors of Prudential Financial and Prudential Insurance. Previously, he was Executive Vice President and COO, International Businesses, of Prudential from 2014 to 2018. He also served as Executive Vice President and COO, U.S. Businesses, of Prudential from 2011 to 2014. He has been a member of the Company’s Executive Leadership Team since 2011. He was CEO and President of Prudential Investment Management, Inc. from January 2008 to February 2011 and CEO of PGIM Real Estate from February 2002 to January 2008. He joined the Company in March 2001, after serving as a managing director and head of the Americas for J.P. Morgan’s Real Estate and Lodging Investment Banking group, where he began his investment banking career in 1988. He also spent four years as a managing partner of an architecture and development firm he founded in New York City. | | Skills & Qualifications • Business Ethics • Business Head/Administration • Business Operations • Corporate Governance • Finance/Capital Allocation • Financial Services Industry • Insurance Industry • International • Investments • Real Estate • Risk Management • Talent Management | | | | |
| | | | | | | | 14 | | | | | Notice of Annual Meeting of Shareholders and 2019 Proxy Statement |
| | |
| | Item 1—Election of Directors:Director Nominees | |
| | | | | | | | | | | | | |  | | George Paz Age:6163 Director Since:March 2016 | | Prudential Committees: • Audit | | Public Directorships: • Express Scripts Holding Company
• Honeywell International, Inc. | | | | | | | Former Directorships Held During the Past Five Years: • Express Scripts Holding Company (December 2018) | | | | | | | | Mr. PazwasNon-Executive Chairman of Express Scripts Holding Company (Express Scripts), a prescription benefit management company, from May 2016 to December 2018 and served as the Chairman and CEO of Express Scripts from May 2006 to May 2016 after being appointed CEO in April 2005. Mr. Paz also served as the President of Express Scripts from October 2003 to February 2014 and as a director from January 2004 to December 2018. He joined Express Scripts in 1998 as SVP and CFO. Prior to joining Express Scripts, Mr. Paz was a partner at Coopers & Lybrand from 1988 to 1993 and 1996 to 1998 and served as Executive Vice President and CFO for Life Partners Group from 1993 to 1995. | | |
Mr. Pazis the Non-Executive Chairman of Express Scripts Holding Company (Express Scripts), a prescription benefit management company, and served as the CEO of Express Scripts from April 2005 to May 2016. Mr. Paz also served as the President of Express Scripts from October 2003 to February 2014 and has been a director since January 2004. He joined Express Scripts in 1998 as SVP and CFO. Prior to joining Express Scripts, Mr. Paz was a partner at Coopers and Lybrand from 1988 to 1993 and 1996 to 1998 and served as Executive Vice President and CFO for Life Partners Group from 1993 to 1995.
Skills & Qualifications | | | • Business Head/Administration • Business Operations • Corporate Governance • Finance/Capital Allocation • Financial Services Industry • Government/Public Policy • Insurance Industry | | • Risk Management • Talent Management |
• Technology/Systems | | | | | 12 | | | Notice of Annual Meeting of Shareholders and 2017 Proxy Statement |
| | | | | Item 1—Election of Directors:Director Nominees
 |
| | | | | | | | | | | | | |  | | Sandra Pianalto Age:6264 Director Since:July 2015 | | Prudential Committees: • Corporate Governance and Business Ethics • Finance | | Public Directorships: • Eaton Corporation plc • FirstEnergy Corp. •The J.M. Smucker Company | | | | | | | | | | | |
Ms. Pianaltoserved as the President and CEO of the Federal Reserve Bank of Cleveland (the Cleveland Fed) from February 2003 until her retirement in May 2014. She was the First Vice President and COO of the Cleveland Fed from 1993 to 2003 and served as its VP and Secretary to the Board of Directors from 1988 to 1993. Ms. Pianalto also served in various supervisory roles at the Cleveland Fed from 1983 to 1988. Prior to joining the Cleveland Fed, Ms. Pianalto was an economist at the Board of Governors of the Federal Reserve System and served on the staff of the Budget Committee of the US House of Representatives.
| | | | | Ms. Pianaltoserved as the President and CEO of the Federal Reserve Bank of Cleveland (the Cleveland Fed) from February 2003 until her retirement in May 2014. She was the First Vice President and COO of the Cleveland Fed from 1993 to 2003 and served as its VP and Secretary to the Board of Directors from 1988 to 1993. Ms. Pianalto also served in various supervisory roles at the Cleveland Fed from 1983 to 1988. Prior to joining the Cleveland Fed, Ms. Pianalto was an economist at the Board of Governors of the Federal Reserve System and served on the staff of the Budget Committee of the U.S. House of Representatives. | | Skills & Qualifications | | | • Academia/Education • Business Head/Administration • Business Operations • Corporate Governance • Finance/Capital Allocation • Financial Services Industry • Government/Public Policy | | • Risk Management • Talent Management | | |
| | | | | | | | Notice of Annual Meeting of Shareholders and 2019 Proxy Statement | | | | | 15 |
| | |
| | Item 1—Election of Directors:Director Nominees | |
| | | | | | | | | | | | | |  | |
Christine A. Poon Age:6466 Director Since:September 2006 | | Prudential Committees: • Executive • Finance (Chair) • Investment • Risk | | Public Directorships: • Koninklijke Philips Electronics NV • Regeneron Pharmaceuticals • The Sherwin-Williams Company | | | | | | | | | | | |
Ms. Poon served as Dean of Fisher College of Business at The Ohio State University from May 2009 until November 2014 and is now a member of the faculty. She served as Vice Chairman and a member of the Board of Directors of Johnson & Johnson from 2005 until her retirement in March 2009. Ms. Poon joined Johnson & Johnson in 2000 as Company Group Chair in the Pharmaceuticals Group. She became a Member of Johnson & Johnson’s Executive Committee and Worldwide Chair, Pharmaceuticals Group, in 2001, and served as Worldwide Chair, Medicines and Nutritionals from 2003 to 2005. Priorto joining Johnson & Johnson, she served in various management positions at Bristol-Myers Squibb for 15 years.
Skills & Qualifications
Academia/Education
Business Head/Administration
Business Operations
Corporate Governance
International
Marketing/Sales
Talent Management
| | | | | | | | | | Ms. Poonhas served as Executive in Residence at The Max M. Fisher College of Business at The Ohio State University since September 2015 and served as Professor of Management and Human Resources at The Max M. Fisher College of Business from October 2014 to September 2015. Ms. Poon previously served as Dean and John W. Berry, Sr. Chair in Business at The Max M. Fisher College of Business at The Ohio State University from April 2009 until October 2014. She served as Vice Chairman and a member of the Board of Directors of Johnson & Johnson from 2005 until her retirement in March 2009. Ms. Poon joined Johnson & Johnson in 2000 as Company Group Chair in the Pharmaceuticals Group. She became a Member of Johnson & Johnson’s Executive Committee and Worldwide Chair, Pharmaceuticals Group, in 2001, and served as Worldwide Chair, Medicines and Nutritionals, from 2003 to 2005. Priorto joining Johnson & Johnson, she served in various management positions at Bristol-Myers Squibb for 15 years. | | Skills & Qualifications • Academia/Education • Business Head/Administration • Business Operations • Corporate Governance • Finance/Capital Allocation • Financial Services Industry • International • Investments • Marketing/Sales • Risk Management • Talent Management | | | | | |   | |
Douglas A. Scovanner Age:6163 Director Since:November 2013 | | Prudential Committees: • Audit (Chair) • Executive • Risk | | | | | | | | | | | | | |
Mr. Scovanner has been the Founder and Managing Member of Comprehensive Financial Strategies, LLC, a management consulting firm, since October 2013. Previously, he served as the CFO (1994 to 2012) and Executive Vice President (2000 to 2012) of the Target Corporation (a North American retailer). Prior to joining the Target Corporation, Mr. Scovanner held various management positions at The Fleming Companies, Inc., Coca-Cola Enterprises, Inc., The Coca-Cola Company and the Ford Motor Company from 1979 to 1994.
| | | | | Mr. Scovannerhas been the Founder and Managing Member of Comprehensive Financial Strategies, LLC, a management consulting firm, since October 2013. Previously, he served as CFO (1994 to 2012) and Executive Vice President (2000 to 2012) of the Target Corporation (a North American retailer). Prior to joining the Target Corporation, Mr. Scovanner held various management positions at The Fleming Companies, Inc., Coca-Cola Enterprises, Inc., The Coca- Cola Company and the Ford Motor Company from 1979 to 1994. | | Skills & Qualifications | | | • Business Head/Administration • Business Operations • Corporate Governance • Finance/Capital Allocation • Financial Services Industry • Investments • Real Estate | | • Risk Management
• Talent Management
|
| | | | | | | Notice of Annual Meeting of Shareholders and 2017 Proxy Statement | | | | 13 | |
| | | | | Item 1—Election of Directors:Director Nominees
|
| | | | | | | | | | | | | |  | | John R. Strangfeld
Age:63
Director Since:January 2008
(Elected Chairman May 2008)
| | Prudential Committees:
• Executive
| | | | | | | | | | | | |
Mr. Strangfeld has served as CEO and President of Prudential Financial since January 2008 and Chairman of the Board since May 2008. Mr. Strangfeld is a member of the Office of the Chairman of Prudential Financial and served as Vice Chairman of Prudential Financial from 2002 through 2007, overseeing the U.S. Insurance and Investment divisions. Prior to his position as Vice Chairman, Mr. Strangfeld held a variety of senior investment positions at Prudential, both within the U.S. and abroad.
Skills & Qualifications
| | | • Business Ethics
• Business Head/Administration
• Business Operations
• Corporate Governance
• Environmental/Sustainability/Corporate Responsibility
• Finance/Capital Allocation
• Financial Services Industry
• Insurance Industry
| | • International
• Investments
• Risk Management • Talent Management • Technology/Systems
|
| | | | | | | | | | | | | |  | |
Michael A. Todman Age:5961 Director Since:March 2016 | | Prudential Committees: • Compensation • Finance | | Public Directorships: • Brown-Forman Corporation • Newell Rubbermaid, Inc.Brands | | | | | | | | | | | |
Mr. Todman served as Vice Chairman of the Whirlpool Corporation (Whirlpool), a global manufacturer of home appliances, from November 2014 to December 2015. Mr. Todman previously served as President of Whirlpool International from 2006 to 2007 and 2010 to 2014, as well as President, Whirlpool North America from 2007 to 2010. Mr. Todman held several senior positions including Executive Vice President and President of Whirlpool Europe from 2001 to 2005 and Executive Vice President, Whirlpool North America, in 2001. Prior to joining Whirlpool, Mr. Todman served in a variety of leadership positions at Wang Laboratories Inc. and Price Waterhouse and Co.
| | | | | Mr. Todmanserved as Vice Chairman of the Whirlpool Corporation (Whirlpool), a global manufacturer of home appliances, from November 2014 to December 2015. Mr. Todman previously served as President of Whirlpool International from 2006 to 2007 and 2010 to 2014, as well as President, Whirlpool North America, from 2007 to 2010. Mr. Todman held several senior positions, including Executive Vice President and President of Whirlpool Europe from 2001 to 2005 and Executive Vice President, Whirlpool North America, in 2001. | | Skills & Qualifications | | | • Business Head/Administration • Business Operations • Corporate Governance • Finance/Capital Allocation • Government/Public Policy • International • Marketing/Sales | | • Risk Management • Talent Management | | |
| | | | | | | | 14 16 | | | | | Notice of Annual Meeting of Shareholders and 20172019 Proxy Statement |
| | |
| | Item 1—Election of Directors:Director Nominees | |
| | | | | | | | Notice of Annual Meeting of Shareholders and 20172019 Proxy Statement | | | | 15| | | 17 |
Corporate Governance The Company is committed to good corporate governance, which helps us compete more effectively, sustain our success and build long-term shareholder value. The Company is governed by a Board of Directors and committees of the Board that meet throughout the year. Directors discharge their responsibilities at Board and committee meetings through ongoing communication with each other and also through other communications with management.management throughout the year. The Board has adopted Corporate Governance Principles and Practices to provide a framework for the effective governance of the Company. The Corporate Governance Principles and Practices are reviewed regularly and updated as appropriate. The full text of the Corporate Governance Principles and Practices, which includes the definition of independence adopted by the Board, the charters of the Corporate Governance and Business Ethics, Compensation and Audit Committees, the Lead Independent Director Charter, the Code of Business Conduct and Ethics and the Related Party Transaction Approval Policy can be found at www.prudential.com/governance. Copies of these documents also may be obtained from the Chief Governance Officer and Corporate Secretary. Governance is a continuing focus at the Company, starting with the Board and extending to management and all employees. Therefore, the Board reviews the Company’s policies and business strategies and advises and counsels the CEO and the other executive officers who manage the Company’s businesses, including actively overseeing and reviewing, on at least an annual basis, the Company’s strategic plans. In addition, we solicit feedback from shareholders on corporate governance and executive compensation practices and engage in discussions with various groups and individuals on governance issues and improvements.these matters. Process for Selecting Directors The Corporate Governance and Business Ethics Committee screens and recommends candidates for nomination by the full Board. The Company’sBy-laws provide that the size of the Board may range from 10 to 24 members. The15 members, reflecting the Board’s current view is that theof its optimal size is between 10 and 15 members.size. The Committee is assisted with its recruitment efforts by an independent third partythird-party search firm, which recommends candidates that satisfy the Board’s criteria. The search firm also provides research and pertinent information regarding candidates, as requested. 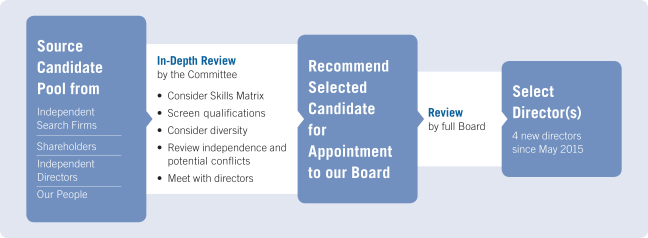
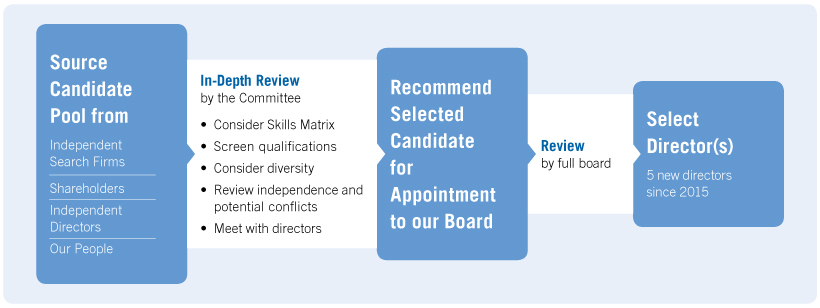 Source Candidate Pool from Independent Search Firms Shareholders Independent Directors Our Source Candidate Pool from Independent Search Firms Shareholders Independent Directors Our Peoplepeople In-Depth Review by the Committee Consider Skills Matrixskills matrics Screen qualifications Consider diversity Review independence and potential conflicts Meet with directors Recommend Selected Candidate for Appointment to our Board Review by full boardBoard Select Director(s) 4 new5 directors since May 20162015
| | | | | 16 | | | 18 | | | | | Notice of Annual Meeting of Shareholders and 20172019 Proxy Statement |
| | |
| | Corporate Governance | |
Shareholder Nominations and Recommendations of Director Candidates We amended ourOurBy-laws in March 2015 to permit a group of up to 20 shareholders who have owned at least 3% of our outstanding capital stock for at least three years to submit director nominees for up to 20% of theour Board seats for inclusion in our Proxy Statement if the shareholder(s) and the nominee(s) meet the requirements in ourBy-laws.
Shareholders who wish to nominate directors for inclusion in our Proxy Statement or directly at an Annual Meeting in accordance with the procedures in ourBy-laws should follow the instructions under “Submission of Shareholder Proposals and Director Nominations” in this Proxy Statement. Shareholders who wish to recommend candidates for consideration should send their recommendations to the attention of Margaret M. Foran, Chief Governance Officer, Senior Vice President and Corporate Secretary, at 751 Broad Street, Newark, NJ 07102. The Committee will consider director candidates recommended by shareholders in accordance with the criteria for director selection described under “Director Criteria, Qualifications, Experience and Tenure.” Director Attendance During 2016,2018, the Board of Directors held 11eight meetings. Together, the directors attended 99% of the combined total meetings of the full Board and the committees on which they served in 2016, and no director attended less than 83% of the combined total meetings of the full Board and the committees on which he or she served in 2016.2018. Director Independence The current Board consists of 13 directors, twothree of whom are currently employed by the Company (Messrs. Lowrey, Grier and Strangfeld). As announced, Mr. Strangfeld will leave the Board on April 5, 2019 and Grier).will not stand for election at the 2019 Annual Meeting. Mr. Falzon, who will join the Board in August 2019 upon Mr. Grier’s retirement, is Vice Chairman of the Company. The Board conducted an annual review and affirmatively determined that all of thenon-employee directors (Mss.(Mses. Hund-Mejean, Pianalto and Poon, and Messrs. Baltimore, Casellas, Cullen, Krapek, Lighte, Paz, Scovanner and Todman) are “independent” as that term is defined in the listing standards of the NYSE and in Prudential Financial’sPrudential’s Corporate Governance Principles and Practices. In addition, the Board previously determined that Mr. Bethune and Ms. Horner, who did not stand forre-election at our 2016 Annual Meeting, were “independent” directors. Independent Director Meetings The independent directors generally meet in an executive session at both the beginning and the end of each regularly scheduled Board meeting, with the Lead Independent Director serving as Chair. 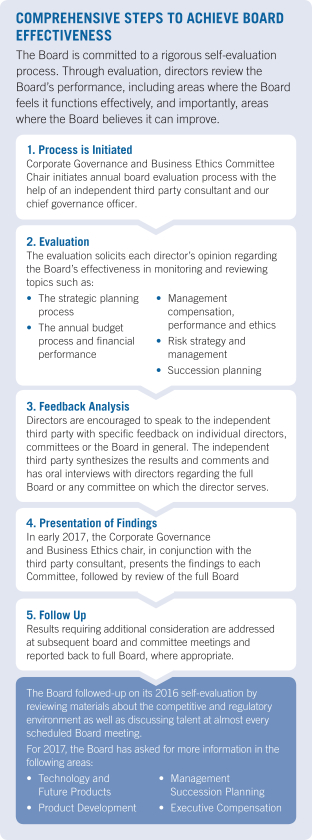
| | | | | | | Notice of Annual Meeting of Shareholders and 2017 Proxy Statement | | | | 17 | |
| | | | | Corporate Governance
|
Board Leadership
Currently, our Board leadership structure consists of a Lead Independent Director, a Chairman (who is also our CEO) and strong committee chairs. The Board believes that our structure provides independent Board leadership and engagement while providing the benefit of having our CEO, the individual with primary responsibility for managing the Company’sday-to-day operations, chair regular Board meetings as key business and strategic issues are discussed. At this time, the Board believes that the Company is best served by having the same individual as both Chairman of the Board and CEO, but considers the continued appropriateness of this structure at least annually.
In 2016, independent directors and our Chief Governance Officer engaged with shareholders, who held a majority of our shares, on their thoughts on our Board leadership structure. Our Lead Independent Director also met with certain of our shareholders in 2016. The discussions and feedback from these meetings has been given to the Board and will be considered during the annual review of the appropriateness of the Board leadership structure.
Under our Corporate Governance Principles and Practices, the independent directors annually elect an independent director to serve as Lead Independent Director for a term of at least one year, but for no more than three years. Mr. Krapek has served as our Lead Independent Director since May 2014. A new Lead Independent Director will be elected by the independent directors immediately after the 2017 Annual Meeting. The responsibilities and authority of the Lead Independent Director include:
presiding at all meetings of the Board at which the Chairman is not present, including executive sessions of the independent directors;
authorization to call meetings of the independent directors;
serving as a liaison between the Chairman and the independent directors;
approving information sent to the Board, including the quality, quantity, appropriateness and timeliness of such information;
approving meeting agendas for the Board;
approving meeting schedules to assure there is sufficient time for discussion of all agenda items;
authorization to retain outside advisors and consultants who report directly to the Board of Directors on board-wide issues; and
ensuring that he/she be available, if requested by shareholders, when appropriate, for consultation and direct communication.
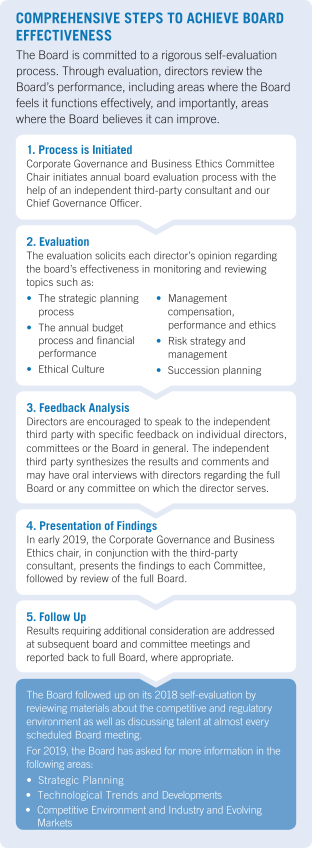 COMPREHENSIVE STEPS TO ACHIEVE BOARD EFFECTIVENESS The Board is committed to a rigorous COMPREHENSIVE STEPS TO ACHIEVE BOARD EFFECTIVENESS The Board is committed to a rigorous self evaluationself-evaluation process. Through evaluation, directors review the Board’sBoard's performance, including areas where the Board feels it functions effectively, and importantly, areas where the Board believes it can improve.1.improve. 1. Process is Initiated Corporate Governance and Business Ethics Committee Chair Initiatesinitiates the annual board evaluation process with the help of an independent third partythird-party consultant and our chief governanceCapitalize Chief Governance officer. 2. Evaluation The evaluation solicits each director’sdirector's opinion regarding the board’sBoard's effectiveness in monitoring and reviewing topics such as:as The strategic planning process The annual budget process and financial performance Management compensation, performance and ethics Risk strategy and management Succession planning 3. Feedback Analysis Directors are encouraged to speak to the independent third party with specific feedback on individual directors, committees or the Board in general. The independent third party synthesizes the results and comments and may have oral interviews with directors regarding the full Board or any committee on which the director serves. 4. Presentation of Findings At the January board meeting,In early 2019, the Corporate Governance and Business Ethics chair,Chair, in conjunction with the independent, third party consultant, presents the findings to each Committee, followed by review of the full BoardBoard. 5. Follow Upup Results requiring additional consideration are addressed at subsequent board and committee meetings and reported back to full Board, where appropriate. The Board followed-up on its most recent2018 self-evaluation by reviewing materials about the competitive and regulatory environment as well as discussing talent at almost every scheduled Board meeting. For 2017,2019, the Board has asked for more information in the following areas: TechnologyStrategic Planning Technological Trends and Future Products Product Development Management Succession Planning Executive CompensationDevelopments Competitive Environment and Industry and Evolving Markets
| | | | | | | | 18 | | | Notice of Annual Meeting of Shareholders and 20172019 Proxy Statement | | | | | 19 |
| | |
| | Corporate Governance | |
Letter from the Lead Independent DirectorBoard Leadership
Under Prudential’s Corporate Governance Principles, the independent directorsCurrently, our Board leadership structure consists of the Board annually elect a Lead Independent Director, and until April 5, 2019, aNon-Executive Chairman (who is our former CEO) as well as strong committee chairs. As previously announced, Mr. Lowrey, our CEO, will become Chairman on April 5, 2019. The Board believes that our structure provides independent Board leadership and engagement while providing the benefit of having our CEO, the individual with primary responsibility for managing the Company’sday-to-day operations, chair regular Board meetings as key business and strategic issues are discussed.
The Board regularly reviews its leadership structure, and the Board thoroughly evaluated whether to continue to combine or to split the chair and CEO roles in the months leading up to the Company’s recent CEO transition. After considering the perspectives of the independent directors, the views of our significant shareholders, voting results of recent independent chair proposals, academic research, practical experience at peer companies, and benchmarking and performance data, the Board determined that having the former CEO becomeNon-Executive Chairman, followed by Mr. Lowey as Chairman and CEO was in the best interests of the Company and its shareholders. The Board will continue to monitor the appropriateness of this structure. In 2018, independent directors and our Chief Governance Officer engaged with shareholders who hold a majority of our shares on their views on our Board leadership structure. Our Lead Independent Director and our chair of the Corporate Governance and Business Ethics Committee, as well as the full Board, also met with certain of our shareholders in 2018. The discussions and feedback from these meetings have been shared with the Board and will be considered during the Board’s annual review of the appropriateness of its leadership structure. Under our Corporate Governance Principles and Practices, the independent directors annually elect a Chairman of the Board and, if the individual elected as Chairman of the Board is the CEO, they also elect an independent director to serve as Lead Independent Director. The Lead Independent Director is generally expected to serve for a term of at least one year, but for no more than three years. I am honored that my fellowMr. Baltimore was elected as Lead Independent Director for his second term in May 2018. The responsibilities and authority of the Lead Independent Director include: presiding at all meetings of the Board at which the Chairman is not present, including executive sessions of the independent directors elected medirectors; authorization to servecall meetings of the independent directors; serving as a liaison between the Chairman and the independent directors; approving information sent to the Board, including the quality, quantity, appropriateness and timeliness of such information; approving meeting agendas for the last three years. My term endsBoard; approving meeting schedules to assure there is sufficient time for discussion of all agenda items; authorization to retain outside advisors and consultants who report directly to the Board on Board-wide issues; and ensuring that he or she be available, if requested by shareholders, when appropriate, for consultation and direct communication. | | | | | | | | 20 | | | | | Notice of Annual Meeting of Shareholders and 2019 Proxy Statement |
| | |
| | Corporate Governance | |
PRUDENTIAL FOLLOWS THE INVESTOR STEWARDSHIP GROUP’S (ISG) CORPORATE GOVERNANCE FRAMEWORK FOR U.S. LISTED COMPANIES | | | | ISG Principle | | Prudential Practice | Principle 1: Boards are accountable to shareholders. | | • All directors stand for election annually • Proxy access with market terms • Board and Lead Independent Director letters and videos provide large and small investors insight into Board strategy and oversight objectives, and corporate governance practices | Principle 2: Shareholders should be entitled to voting rights in proportion to their economic interest. | | • No dual class structure; each shareholder gets one vote per share • Majority voting in uncontested director elections, and directors not receiving majority support must tender their resignation for consideration by the Board | Principle 3: Boards should be responsive to shareholders and be proactive in order to understand their perspectives. | | • Management and Board members met with investors owning a majority of shares outstanding in 2018 • Engagement topics included sustainability and social strategy, Board composition, leadership and refreshment, succession planning, and executive compensation program | Principle 4: Boards should have a strong, independent leadership structure. | | • Strong Lead Independent Director with clearly defined duties that are disclosed to shareholders • Board considers appropriateness of its leadership structure at least annually • Strong Independent Committee Chairs • Proxy discloses why Board believes current leadership structure is appropriate | Principle 5: Boards should adopt structures and practices that enhance their effectiveness. | | • As of April 5, 2019, 83% of Board members are independent • 80% of our independent Board members are diverse • Annual Board evaluation by independent third party; results and next steps summarized in proxy statement • Active Board refreshment plan; five new Board members refreshment in last four years • Directors attended 99% of combined total Board and applicable committee meetings in 2018, and all directors attended the 2018 Annual Meeting | Principle 6: Boards should develop management incentive structures that are aligned with the long-term strategy of the company. | | • Executive Compensation program received approximately 96% shareholder support in 2018 • Compensation Committee annually reviews and approves incentive program design, goals and objectives for alignment with compensation and business strategies • Annual and long-term incentive programs are designed to reward financial and operational performance that furthers short- and long-term strategic objectives | | | |
SHAREHOLDER ENGAGEMENT This year, we continued our practice of engagement, communication, and transparency in May 2017, effective ata variety of ways, including the following: | • | | released two videos featuring Board members, Thomas J. Baltimore, our Lead Independent Director, and Douglas A. Scovanner, Chair of our Audit Committee, sharing their views on Prudential’s Board and corporate governance practices; | |
| • | | promoted greater communication with our institutional shareholders on corporate governance issues by engaging with shareholders who collectively hold a majority of our shares; | |
| • | | advanced open Board communication by facilitating interaction between our directors and shareholders; and | |
| • | | provided multiple avenues for shareholders to communicate with the Company and the Board, and have received and responded to shareholder comments. Shareholders also continued to use the mechanisms available through www.prudential.com/governance to provide input. | |
| | | | | | | | Notice of Annual Meeting of Shareholders and 2019 Proxy Statement | | | | | 21 |
| | |
| | A Message to our Shareholders from Prudential’sLead Independent Director | |
Letter from the Lead Independent Director As Prudential’s lead independent director, it is a privilege to share with you the Board’s view on the Company’s governance practices that we believe reflect our Annual Meeting. Our directors share myongoing commitment to strong, independent leadership,building long-term shareholder value. Succession Planning Succession planning is paramount to the Board’s oversight and is a point of discussion and deliberation at every Board effectivenessmeeting. In September 2018, John Strangfeld announced his retirement ending his11-year tenure as Prudential’s CEO and oversight. In this context, I would likeChairman. The Board was honored to share insights into our philosophyannounce the appointments of Charles Lowrey, former Executive Vice President and practices on several important issues.Chief Operating Officer, International Businesses, to the role of Chief Executive Officer, and Robert Falzon, former Executive Vice President and Chief Financial Officer, to the role of Vice Chairman, succeeding Mark Grier. Strategic Oversight
As partThese transitions are indicative of the annualdepth and breadth of the firm’s talent pool. Charlie and Rob are accomplished business leaders with significant related experience that will shape Prudential’s strategic planning process,vision and long-term strategy.
Board Effectiveness It is our goal to operate our Board reviewsin the Company’s strategy, opportunities, challenges, capabilitiesmost effective manner possible, and leadership to ensure the Company is well-positioned to continue creating value for shareholders. My fellow independent directors and I are committed to, and value, our dialogue with management regarding the Company’s disciplined risk assessment, capital allocation strategy and long-term plans for growth. Board Governance
Effective governance means ongoing and thoughtfulwe believe a rigorous annual evaluation of our governance structure, and constructive shareholder engagement on emerging governance issues. In 2016, our engagement efforts, which included my personal involvement and that of other directors, reached investors holding the majority of our outstanding shares.
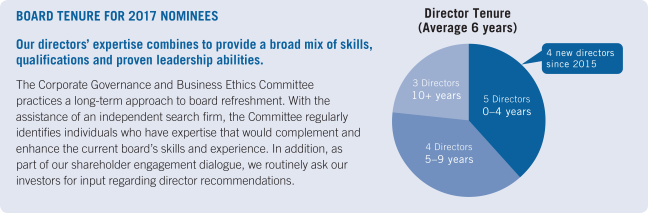
Our recent shareholder engagement dialogue about governance has focused on, among other things, Board composition, refreshment and our Board’s leadership structure. Understanding the importance of the Board’s responsibility to provide effective oversight, we strive to maintain an appropriate balance of tenure, diversity, skills, and experience on the Board. Since 2015, four new independent directors have joined our Board to replace long-tenured directors. In addition, directors from diverse backgrounds comprisetwo-thirds of our Board.
Board Evaluation
We are committed to provide transparency to our robust Board and committee evaluation process, which is led by an independent third party is an essential component of good governance practices. Every year, the Corporate Governance and Business Ethics Committee works with an experienced, third-party consultant. Our proxy statement not only describes each stepconsultant to complement our internal evaluation efforts by introducing an objective perspective and knowledge of best practices. We believe this approach adds rigor to the evaluation process, but also provides specificprocess.
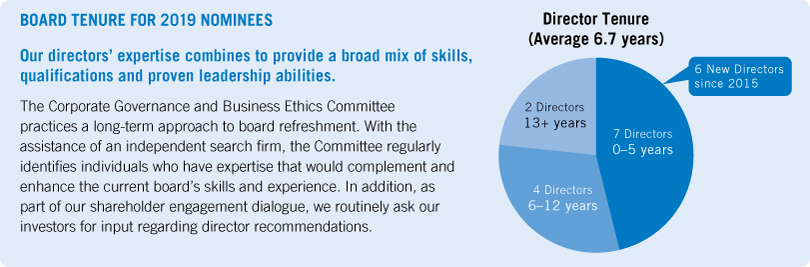
Board Composition and Refreshment We believe strong governance begins with an independent, engaged and diverse board – 80% of our independent board members are diverse. With these guiding principles, the Corporate Governance and Business Ethics Committee screens and recommends Board candidates for nomination with the goal of evolving the composition of our Board in line with the strategic needs of our global customers. Using our skills matrix as a guide, individual conversations with directors, and the assistance of an independent search firm, the Committee identifies areas where our directors seek improvement.of expertise that would complement and enhance the current Board’s skills and experience. Over the past several years, we have added five new Board members. Governance Policies and Practices We continue to maintain our focus on strong governance practices thatwhich we believe are important to our shareholders and protect the long-term vitality of the Company. Our accountability to you is indicativeillustrated in our policies such as: proxy access, a strong Lead Independent Director role, the right of shareholders to call a special meeting, the annual director elections by majority vote, annual election of directors, and a robust clawback policy. My board colleague, Gilbert Casellas, chairmanDouglas Scovanner, chair of our Corporate Governance and Business Ethicsthe Audit Committee, and I address these topics in two short videos. You can access the videos from the Corporate Governance section of our website at www.prudential.com/directorvideos. We see these videos as an important component of our ongoing efforts to share information with shareholders. Prudential’s founder, John Dryden, stated thatOn behalf of our shareholders, your Board is committed to maintaining our diligence in overseeing the “justification of the company’s existence is its advancement of the efforts of its policy holdersfirm’s performance, risk management, and their families for better economicinvestment in our people and social condition.” More than 140 years after Mr. Dryden’s proclamation, my fellow directors and I are proud to carry on this purpose on your behalf.communities.
Sincerely, 
Thomas J. Baltimore Lead Independent Director | | | | | | | 
| | 
KarlThomas J. KrapekBaltimore
Mr. Baltimore was elected by Prudential’s independent directors to serve as Lead Independent Director effective May 9, 2017. Mr. Baltimore brings significant experience and knowledge to the Lead Independent Director role. He has served as a Prudential director since 2008. During his tenure, he has chaired the Investment, Executive and Risk Committees, and served on the Compensation and Finance Committees. Due to his Board experience and leadership, Mr. Baltimore understands the Company’s long-term strategic priorities. In addition, he possesses a deep understanding of Prudential and its industry’s legal, regulatory, and competitive frameworks. | | |
| | | | | | | | 22 | | | | | Notice of Annual Meeting of Shareholders and 2019 Proxy Statement |
| | |
| | Corporate Governance | |
Why our Board Structure Is Right for Prudential and its Shareholders Prudential’s Board leadership structure is reviewed by our Corporate Governance and Business Ethics Committee regularly. Upon John Strangfeld’s retirement, the Board again gave careful deliberation to its structure and determined that a combined Chairman-CEO role continues to be in the best interest of our firm and shareholders. As independent directors, we believe the current structure promotes an effective Board that enables us to provide strategic guidance, challenge management’s perspectives, and meet with relevant internal and external constituents important to the Company’s operational and regulatory initiatives. The independent directors annually select an independent member to serve as the Lead Independent Director. As required by the Lead Independent Director Charter, the Lead Independent Director is precluded from serving longer than three consecutive years. Charles Lowrey, former executive vice president and chief operating officer of Prudential’s International Businesses, was appointed CEO on December 1, 2018. He will be appointed Chairman on April 5, 2019. Charlie’s successful leadership of the Company’s asset management, U.S. and international businesses enables him to bring a broad perspective of Prudential’s operations, a deep understanding of our people, and leadership skills that will serve the Company well as it continues to grow. The Board believes a Chairman-CEO structure provides Prudential with a clear and effective leadership role to communicate the Company’s business and long-term strategy to its clients, shareholders and the public. The combination also provides for robust and frequent communication between the Board’s independent directors and Company management. On behalf of our shareholders, the Board is committed to advancing our momentum in the market. This transition is the result of a thoughtful, phased and long-term approach to succession planning. Lead Independent Director:Key Responsibilities Calls meetings of the independent directors Facilitates communication between the independent directors and our Chairman Provides independent Board leadership Elected annually to serve no more than three years Sets agenda for all Board meetings and approves all Board material Communicates with shareholders and other key constituents, as appropriate Meets directly with the management andnon-management employees of our firm Engages with our other independent directors to identify matters for discussion at executive sessions of independent directors and advises our Chairman of any decisions reached, and suggestions made at the executive sessions In collaboration with the Corporate Governance and Business Ethics Committee, addresses Board effectiveness, performance and composition Authorized to retain outside advisors and consultants who report directly to the Board on Board-wide issues | Culture at Prudential At Prudential, nearly 50,000 employees from around the globe bring their diverse backgrounds and perspectives to work every day in
pursuit of the company’s shared purpose: making lives better by solving the financial challenges of a changing world. Drawing on a wide range of expertise and experience across a multitude of disciplines, we are bound by our commitment to what we do
and how we work together. This means that culture is a unique differentiator and a long-term competitive advantage for Prudential. It fuels our ability to execute in differentiated ways and is a critical underpinning of our talent strategy. Therefore, we invest in understanding and developing our culture. We want to ensure that it is as inclusive and collaborative as it can be, and that it supports how we compete in an evolving marketplace. In July 2018, Prudential asked thousands of employees across the United States to share their vision for our culture and for Prudential. Solicited in a spirit of candor and continual improvement, the results provided valuable guidance for our approach to business challenges and talent opportunities. These results were shared with the Board of Directors and senior leadership, and the feedback will help the company support a fully inclusive culture that unlocks the best-in-class execution, collaboration, and performance of our talent. |
| | | | | | | | Notice of Annual Meeting of Shareholders and 20172019 Proxy Statement | | | | 19| | | 23 |
| | |
| | Corporate Governance | |
Board Risk Oversight The Board oversees the Company’s risk profile and management’s processes for assessing and managing risk, through both as athe whole Board and through its committees. At least annually, the Board reviews strategic risks and opportunities facing the Company and certain of its businesses. Other important categories of risk are assigned to designated Board committees (which are comprised solely of independent directors) that report back to the full Board. In general, the committees oversee the following risks: Audit Committee:insurance risk and operational risks, including model risk, as well as risks related to financial controls, legal, regulatory and compliance issues,risks, and the overall risk management governance structure and risk management function; Compensation Committee:the design and operation of the Company’s compensation programs so that they do not encourage unnecessary or excessive risk-taking; Corporate Governance and Business Ethics Committee:the Company’s overall ethical culture, political contributions, lobbying expenses and overall political strategy, as well as the Company’s environmental risk (which includes climate risk), sustainability and corporate social responsibility to minimize reputational risk and focus on future sustainability; Finance Committee:liquidity risk, risks related toinvolving our capital and liquidity management, the incurrence and repayment of borrowings, the capital structure of the enterprise, funding of benefit plans and the levels ofstatutory insurance reserves and policyholder dividends;reserves; Investment Committee:investment risk, market risk and the strength of the investment function; and Risk Committee:the governance of significant risks throughout the Company, the Company’s overallestablishment and ongoing monitoring of our risk profile, risk capacity and risk appetite, and coordination of the risk oversight functions of the other Board committees. In performing its oversight responsibilities, the Board and its committees review policies and guidelines that senior management uses to manage the Company’s exposure to material categories of risk. As these issues sometimes overlap, Board committees hold joint meetings when appropriate and address certain issues at the full Board level. During 2016,2018, the full BoardRisk Committee received a reportan update from the Chief Risk Officer on the important strategic issues and risks facing the Company. In addition, the Board and committees review the performance and functioning of the Company’s overall risk management function. The Risk Committee is comprised of the chairs of each of the other Board committees.committees and Mark Grier, our Vice Chairman, who supervises the Chief Risk Officer of the Company. The principal activities of the Risk Committee are to: oversee the Company’s assessment and reporting of material risks by reviewing the metrics used by management to quantify risk, applicable risk limit structures and risk mitigation strategies; review the Company’s processes and procedures for risk assessment and risk management, including the related assumptions used across the Company’s businesses and material risk types; and receive reports from management on material and emerging risk topics that are reviewed by the Company’s internal management committees. The Company, under the Board’s oversight, is organized to promote a strong risk awareness and management culture. The Chief Risk Officer sits on many management committees and heads an independent enterprise risk management department; the General Counsel and Chief Compliance Officer also sit on key management committees and the functions they oversee operate independently of the businesses to separate management and oversight. Employee appraisals evaluate employees with respect to risk and ethics. Cybersecurity Risk Oversight In addition, the Board oversees the Company’s cyber risk management program. In order to respond to the threat of security breaches and cyberattacks, we have developed a program, overseen by the Company’s Chief Information Security Officer and our Information Security Office, that is designed to protect and preserve the confidentiality, integrity and continued availability of all information owned by, or in the care of, the Company. This program also includes a cyber incident response plan that provides controls and procedures for timely and accurate reporting of any material cybersecurity incident. The Audit Committee, which is tasked with oversight of certain risk issues, including cybersecurity, receives periodic reports from the Chief Information Security Officer, the Chief Information Officer and the Head of Operational Risk. The Board and the Audit Committee also periodically receive updates about the results of exercises and response readiness assessments led by outside advisors who provide a third-party independent assessment of our technical program and our internal response preparedness. The Audit Committee regularly briefs the full Board on these matters, and the full Board also receives periodic briefings on cyber threats in order to enhance our directors’ literacy on cyber issues. | | | | | | | | 24 | | | | | Notice of Annual Meeting of Shareholders and 2019 Proxy Statement |
| | |
| | Corporate Governance | |
Executive Compensation Risk Oversight We monitor the risks associated with our executive compensation programprograms and individual executive compensation decisions on an ongoing basis. Each year, management undertakes a review of the Company’s various compensation programs to assess the risks arising from our compensation policies and practices. Management presents these risk assessments to the Compensation Committee. The risk assessments have included a review of the primary design features of the Company’s compensation plans, the process to determine compensation pools and awards for employees and an analysis of how those features could directly or indirectly encourage or mitigate risk-taking. As part of the risk assessments, it has been noted that the Company’s compensation plans allow for discretionary negative adjustments to the ultimate outcomes, which serves to mitigate risk-taking. Moreover, senior management is subject to a share ownership and retention policy,policies, and historically a large percentage of senior management compensation has been paid in the form of long-term equity awards. In addition, senior management compensation is paid over a multiple-year cycle, a compensation structure that is intended to align incentives with appropriate risk-taking. The Company’s general risk management controls also serve to preclude decision-makers from taking excessive risk to earn the incentives provided under our compensation plans. The Compensation Committee agreed with the conclusion that the identified risks were within our ability to effectively monitor and manage, and that our compensation programs do not encourage unnecessary or excessive risk-taking and do not create risks that are reasonably likely to have a material adverse effect on the Company. | | | | | 20 | | | Notice of Annual Meeting of Shareholders and 2017 Proxy Statement |
| | | | | Corporate Governance
|
Succession Planning The Board is actively engaged and involved in talent management. The Board reviews the Company’s “people strategy” in support of its business strategy at least annually and frequently discusses talent issues at its meetings. This includes a detailed discussion of the Company���sCompany’s global leadership bench and succession plans with a focus on key positions at the senior officer level. As a result of this approach, the Board was well positioned to execute on its succession plan in 2018, including the appointment of Mr. Lowrey to succeed Mr. Strangfeld as CEO and Chairman and Mr. Falzon to succeed Mr. Grier as Vice Chairman. In addition, the committees of the Board regularly discuss the talent pipeline for specific critical roles. High potentialHigh-potential leaders are given exposure and visibility to Board members through formal presentations and informal events. More broadly, the Board is regularly updated on key talent indicators for the overall workforce, including diversity, recruiting and development programs. Communication with Directors Shareholders and other interested parties may communicate with any of the independent directors, including Committee Chairs and the Lead Independent Director, by using the following address: Prudential Financial, Inc. Board of Directors c/o Margaret M. Foran, Chief Governance Officer, Senior Vice President and Corporate Secretary 751 Broad Street Newark, NJ 07102 Email: independentdirectors@ prudential.com Feedback on Executive Compensation: You can also provide feedback on executive compensation at the following website: www.prudential.com/ executivecomp. The Chief Governance Officer and Corporate Secretary of the Company reviews communications to the independent directors and forwards those communications to the independent directors as discussed below. Communications involving substantive accounting or auditing matters will be immediately forwarded to the Chair of the Audit Committee and the Company’s Corporate Chief Ethics Officer consistent with time frames established by the Audit Committee for the receipt of communications dealing with these matters. Communications that pertain tonon-financial matters will be forwarded promptly. Items that are unrelated to the duties and responsibilities of the Board will not be forwarded, such as: business solicitation or advertisements; product-related inquiries; junk mail or mass mailings; resumes or otherjob-related inquiries; spam and overly hostile, threatening, potentially illegal or similarly unsuitable communications. SHAREHOLDER ENGAGEMENT
This year, we continued our practice of engagement, communication, and transparency in a variety of ways, including the following:
| • | | released two videos featuring Board members, Karl J. Krapek, our Lead Independent Director, and Gilbert Casellas, Chair of our Corporate Governance and Business Ethics Committee, sharing their views on Prudential’s Board and governance practices; | |
| • | | provided multiple avenues for shareholders to communicate with the Company and the Board. We have received almost 15,000 shareholder comments in the last six years. Shareholders also continued to use the mechanisms available through www.prudential.com/governance to provide input; | |
| • | | promoted greater communication with our institutional shareholders on corporate governance issues by engaging with shareholders who collectively held a majority of our shares; | |
| • | | advanced open Board communication by facilitating interaction between our directors and shareholders; and | |
| • | | received nomination from Corporate Secretary Magazine for Best Proxy Statement for a Large Cap Company. | |
| | | | | | | | Notice of Annual Meeting of Shareholders and 20172019 Proxy Statement | | | | 21| | | 25 |
| | |
| | Corporate Governance | |
Committees of the Board of Directors The Board has established various committees to assist in discharging its duties, including: Audit, Compensation, Corporate Governance and Business Ethics, Executive, Finance, Investment and Risk. The primary responsibilities of each of the committees are set forth below, together with their current membership and the number of meetings held in 2016.2018. Committee charters can be found on our website at www.prudential.com/governance. Each member of the Audit, Compensation, and Corporate Governance and Business Ethics Committees has been determined by the Board to be independent for purposes of the NYSE Corporate Governance listing standards. In addition, directors who serve on the Audit Committee and the Compensation Committee meet additional, heightened independence and qualification criteria applicable to directors serving on these committees under the NYSE listing standards. | | | | | Committees | | Members & Meetings in 20162018 | | Description | Audit Committee Meetings in 2016:2018: 10 | | Douglas A. Scovanner (Chair) Martina-Hund Mejean George Paz | | The Audit Committee provides oversight of the Company’s accounting and financial reporting and disclosure processes, the adequacy of the systems of disclosure and internal control established by management, and the audit of the Company’s financial statements. The Audit Committee oversees insurance risk and operational risks, risks related to financial controls, and legal, regulatory and compliance matters, and oversees the overall risk management governance structure and risk management function. Among other things, the Audit Committee: (1) appoints the independent auditor and evaluates its qualifications, independence and performance; (2) reviews the audit plans for and results of the independent audit and internal audits; and (3) reviews reports related to processes established by management to provide compliance with legal and regulatory requirements. The Board of Directors has determined that all of our Audit Committee members are financially literate and are audit committee financial experts as defined by the SEC. | Compensation Committee Meetings in 2016:2018: 7 | | Karl J. Krapek (Chair) Thomas J. Baltimore Michael A. Todman | | The Compensation Committee oversees the Company’s compensation and benefits policies and programs. For more information on the responsibilities and activities of the Compensation Committee, including the Committee’s processes for determining executive compensation, see the CD&A. | Corporate Governance & Business Ethics Committee Meetings in 2016: 62018: 7 | | Gilbert F. Casellas (Chair) Peter R. Lighte Sandra Pianalto | | The Corporate Governance and Business Ethics Committee oversees the Board’s corporate governance procedures and practices, including the recommendations of individuals for the Board, making recommendations to the Board regarding director compensation and overseeing the Company’s ethics and conflict of interest policies, its political contributions and lobbying expenses policy, and its strategy and reputation regarding environmental stewardship, sustainability, and sustainabilitycorporate social responsibility throughout the Company’s global businesses. | Executive Committee(1) Meetings in 2016:2018: 0 | | Karl J. Krapek (Chair)
Thomas J. Baltimore (Chair) Gilbert F. Casellas Karl J. Krapek Charles F. Lowrey Christine A. Poon Douglas A. Scovanner John R. Strangfeld | | The Executive Committee is authorized to exercise the corporate powers of the Company between meetings of the Board, except for those powers reserved to the Board by ourBy-laws or otherwise. | Finance Committee Meetings in 2016: 72018: 5 | | Christine A. Poon (Chair) James G. Cullen
Sandra Pianalto Michael A. Todman | | The Finance Committee oversees, takes actions, and approves policies with respect to capital, liquidity, borrowing levels, reserves, subsidiary structurebenefit plan funding and major capital expenditures. | Investment Committee Meetings in 2016:2018: 4 | | Thomas J. Baltimore (Chair) James G. Cullen
Peter R. Lighte Christine A. Poon | | The Investment Committee oversees and takes actions with respect to the acquisition, management and disposition of invested assets; reviews the investment performance of the pension plan and funded employee benefit plans; and reviews investment risks and exposures, as well as the investment performance of products and accounts managed on behalf of third parties. | Risk Committee Meetings in 2016: 72018: 5 | | Karl J. Krapek (Chair)
Thomas J. Baltimore (Chair) Gilbert F. Casellas Mark B. Grier Karl J. Krapek Christine A. Poon Douglas A. Scovanner | | The Risk Committee oversees the governance of significant risks throughout the enterprise including by coordinating the risk oversight functions of each Board committee and seeing that matters are appropriately elevated to the Board. |
| (1) | Charles Lowrey was elected to the Executive Committee on January 25, 2019 |
In addition to the above Committee meetings, the Board held 11eight meetings in 2016.2018. | | | | | 22 | | | 26 | | | | | Notice of Annual Meeting of Shareholders and 20172019 Proxy Statement |
| | |
| | Corporate Governance | |
Certain Relationships and Related Party Transactions The Company has adopted a written Related Party Transaction Approval Policy that applies: to any transaction or series of transactions in which the Company or a subsidiary is a participant; when the amount involved exceeds $120,000; and when a related party (a director or executive officer of the Company, any nominee for director, any shareholder owning an excess of 5% of the total equity of the Company and any immediate family member of any such person) has a direct or indirect material interest (other than solely as a result of being a director or trustee or in any similar position or a less than 10 percent10% beneficial owner of another entity). The policy is administered by the Corporate Governance and Business Ethics Committee. The Committee will consider relevant facts and circumstances in determining whether or not to approve or ratify such a transaction, and will approve or ratify only those transactions that are, in the Committee’s judgment, appropriate or desirable under the circumstances. In the ordinary course of business, we may from time to time engage in transactions with other corporations or financial institutions whose officers or directors are also directors of Prudential Financial. In all cases, these transactions are conducted on anarm’s-length basis. In addition, from time to time executive officers and directors of Prudential Financial may engage in transactions in the ordinary course of business involving services we offer, such as insurance and investment services, on terms similar to those extended to employees of Prudential Financial and its subsidiaries and affiliates generally. The Corporate Governance and Business Ethics Committee has determined that certain types of transactions do not create or involve a direct or indirect material interest, including (i) any sales of financial services or products to a related party in the ordinary course of business on terms and conditions generally available in the market placemarketplace (or at ordinary employee discounts, if applicable) and in accordance with applicable law and (ii) all business relationships between the Company and a 5% shareholder or a business affiliated with a director, director nominee or immediate family member of a director or director nominee made in the ordinary course of business on terms and conditions generally available in the market placemarketplace and in accordance with applicable law. Pursuant to our policy, the Corporate Governance and Business Ethics Committee determined that there were twothree transactions that qualified as related party transactions since the beginning of 2016.2018. The brother of Robert M. Falzon, our ExecutiveVice Chairman, Michael F. Falzon, is our Vice President, and Chief Financial Officer, Michael Falzon, is a Vice President for Infrastructure Systems Development. In 2016,2018, the total compensation paid to Michael Falzon, including salary, bonus and the grant date value of long-term incentive awards, was approximately $480,300.$600,000. Theson-in-law of Barbara Koster, our Senior Vice President and Chief Information Officer, Joshua D. Howard, is an associate in Quantitative Management Associates, a subsidiary of the Company. In 2016,2018, the total compensation paid to Mr. Howard, including salary and bonus, was approximately $141,500.$165,000. The daughter of Timothy L. Schmidt, our Senior Vice President and Chief Investment Officer, Carley J. Berger, is an associate in the actuarial department. In both2018, the total compensation paid to Ms. Berger, including salary and bonus, was approximately $130,000. In all three cases, the individuals’ compensation iswas similar to the compensation of other employees holding equivalent positions. Neither individual is in the reporting chain of the executive officer. SUSTAINABILITY AND ENVIRONMENT
At Prudential, sustainability represents how the Company anticipates and manages future risks and opportunities to meet its long-term promises. Sustainability advocates have noted Prudential’s work in the field, especially the active involvement of the Board and senior leadership. Sustainability highlights in 2016 include:
Providing the Board’s Corporate Governance and Business Ethics Committee with a formal report on the Company’s strategy and developments.
Engaging with industry groups, advocates and shareholders on our efforts. A team of Prudential senior leaders participated in a dialogue with the leader of the Geneva Association’s Extreme Events and Climate Risk Working Group.
Facilitating a dialogue between Ceres, a non-profit advocating sustainability leadership, and selected Company executives on Prudential’s sustainability progress. Prudential receives feedback on its sustainability efforts from Ceres and as part of ongoing stakeholder engagement.
| • | | Receiving LEED Gold Certification from the U.S. Green Building Council for the new Prudential tower in Newark, NJ. | |
| • | | Inviting registered shareholders to steward natural resource conservation by accessing shareholder materials online, voting online and registering for direct deposit of dividends. | |
| • | | Releasing our annual sustainability report — Build, Preserve. Repeat. — with stakeholder input shaping the content. To review the report visitwww.prudential.com/sustainability. | |
| • | | Adhering to the criteria for inclusion in the FTSE4Good Index Series since 2011, which measures the performance of companies’ environmental, social and governance (ESG) practices. | |
| | | | | | | | Notice of Annual Meeting of Shareholders and 20172019 Proxy Statement | | | | 23| | | 27 |
| | |
| | Corporate Governance | |
Policy on Shareholder Rights Plan We do not have a shareholder rights plan. The Board will obtain shareholder approval prior to adopting a future shareholder rights plan unless the Board, in the exercise of its fiduciary duties, determines that under the circumstances then existing, it would be in the best interests of the Company and our shareholders to adopt a rights plan without prior shareholder approval. If a rights plan is adopted by the Board without prior shareholder approval, the plan must provide that it will expire within one year of adoption unless ratified by shareholders. Political Contributions and Lobbying Expenditure Oversight and Disclosure The Corporate Governance and Business Ethics Committee reviews and approves an annual report on political activities, contributions and lobbying expenses. It monitors and evaluates the Company’s ongoing political strategy as it relates to overall public policy objectives for the next year and provides guidance to the Board. We provide on our website a description of our oversight process for political contributions and a summary of PAC contributions. We also includedisclose semiannual information on annual dues, assessments and contributions of $25,000$10,000 or more to trade associations andtax-exempt advocacy groups and a summary of Company policies and procedures for political activity. This disclosure is available at www.prudential.com/governance under the heading “Political Activity & Contributions.” In 2016, Prudential received a
The 2018CPA-Zicklin designation as Trendsetter. This honor represents atop-five ranking for political disclosure and accountability in the 2016CPA-Zicklin Trendsetters Designation Index of Corporate Political Disclosure and Accountability.Accountability ranked Prudential as a Trendsetter company, the highest distinction. This is the fourth consecutive year that Prudential has been recognized for its disclosure, accountability, and political spending oversight. Environmental, Sustainability and Corporate Social Responsibility The Corporate Governance and Business Ethics Committee has oversight of environmental issues and policies. In addition, three of our Board members sit on the Board’s Corporate Social Responsibility Oversight Committee. These directors inform the Company’s social responsibility efforts in investing for financial and social returns, strategic philanthropy, employee engagement and corporate community involvement. 2018 investments include: CORPORATE RESPONSIBILITY
The Office of Corporate Social Responsibility extends the reach of Prudential’s business model to create pathways for all individuals and families to achieve financial and social mobility.
In 2016, Prudential invested:
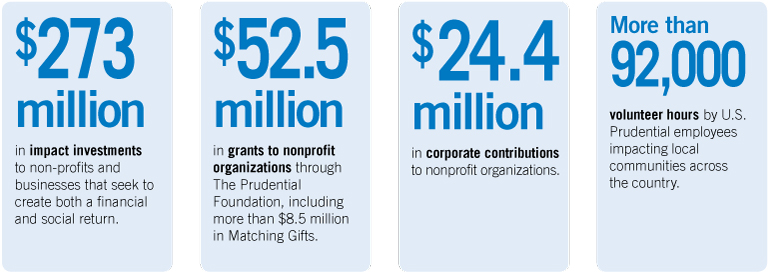
$41 million in grants to non-profit organizations through The Prudential Foundation; $237273 million in impact investments tonon-profits and businesses that seek to create both a financial and social return. In 2016, the company reached the halfway mark$52.5 million in grants to achieving its goal of having a $1 billion impact investment portfolio by 2020; and
$15nonprofit organizations through The Prudential Foundation. $24.4 million in corporate contributions tonon-profit organizations, including more than $5 million in projects serving U.S. veterans.
More than 92,000 volunteer hours by U.S. Prudential employees continuedimpacting local communities across the Company’s long tradition of corporate community involvement. For these efforts, Prudential has once again been named to the Civic 50 list celebrating America’s most community-minded companies, an honor awarded by thenon-profit organization Points of Light. | | | | | 24 | | | Notice of Annual Meeting of Shareholders and 2017 Proxy Statement |
| | | | | Corporate Governance: Good Governance Practices
|
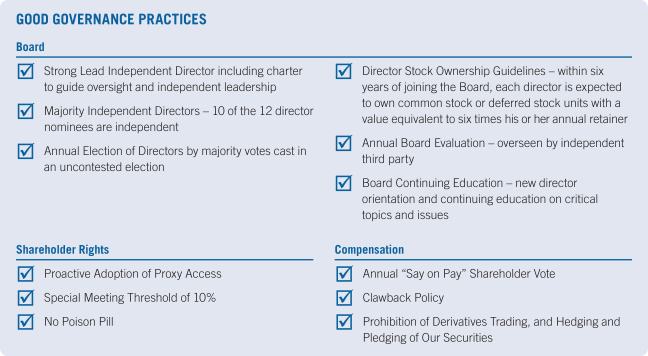
GOOD GOVERNANCE PRACTICES Board Strong Lead Independent Director including charter to guide oversight and independent leadership Majority Independent Directors – 10 of the 12 director nominees are independent Annual Election of Directors by majority votes cast in an uncontested election Shareholder Rights Proactive Adoption of Proxy Access Special Meeting Threshold of 10% No Poison Pill Director Stock Ownership Guidelines – within six years of joining the Board, each director is expected to own common stock or deferred stock units with a value equivalent to six times their annual retainer Annual Board Evaluation – overseen by independent third party every year Board Continuing Education – new director orientation and continuing education on critical topics and issues Compensation Annual Say on Pay Shareholder Vote Clawback Policy Prohibition of Derivatives Trading, and Hedging and Pledging of Our Securitiescountry.
| | | | | | | | 28 | | | | | Notice of Annual Meeting of Shareholders and 20172019 Proxy Statement | | | | 25 | |
Item 2–Ratification of the Appointment of the Independent Registered Public Accounting Firm The Audit Committee of the Board of Directors has appointed PricewaterhouseCoopers LLP (“PricewaterhouseCoopers” or “PwC”) as the Company’s independent registered public accounting firm (independent auditor)(“independent auditor”) for 2017.2019. We are not required to have the shareholders ratify the selection of PricewaterhouseCoopers as our independent auditor. We nonetheless are doing so because we believe it is a matter of good corporate practice. If the shareholders do not ratify the selection, the Audit Committee will reconsider whether or not to retain PricewaterhouseCoopers, but may nevertheless retain it as the Company’s independent auditor. Even if the selection is ratified, the Audit Committee, in its discretion, may change the appointment at any time during the year if it determines that such a change would be in the best interest of Prudential Financial and its shareholders. Representatives of PricewaterhouseCoopers will be present at the Annual Meeting and will have the opportunity to make a statement and be available to respond to appropriate questions by shareholders. FEES PAID TO PRICEWATERHOUSECOOPERS LLP The following is a summary and description of fees for services provided by PricewaterhouseCoopers in 20162018 and 2015.2017. Worldwide Fees (In Millions)(in millions) | | | | | | | | | Service | | 2016 | | | 2015 | | Audit(A) | | $ | 51 | | | $ | 50 | | Audit-Related(B) | | $ | 4 | | | $ | 4 | | Tax(C) | | $ | 3 | | | $ | 2 | | All Other | | | — | | | | — | | | Total | | $ | 58 | | | $ | 56 | |
| | | | | | | | | | | | | Service | | 2018 | | | 2017 | | | | | Audit(1) | | $ | 52 | | | $ | 52 | | | | | Audit-Related(2) | | $ | 6 | | | $ | 5 | | | | | Tax(3) | | $ | 3 | | | $ | 3 | | | | | All Other(4) | | | — | | | $ | 1 | | | | | Total | | $ | 61 | | | $ | 61 | |
(A)(1) | The aggregate fees for professional services rendered for the integrated audit of the consolidated financial statements of Prudential Financial and, as required, audits of various domestic and international subsidiaries, the issuance of comfort letters, agreed-upon procedures required by regulation, consents and assistance with review of documents filed with the SEC. |
(B)(2) | The aggregate fees for assurance and related services, including internal control and financial compliance reports, agreed-upon procedures not required by regulation, and accounting consultation on new accounting standards, acquisitions and potential financial reporting requirements. |
(C)(3) | The aggregate fees for services rendered by PricewaterhouseCoopers’ tax department for tax return preparation, tax advice related to mergers and acquisitions and other international, federal and state projects, and requests for rulings. In 2016,each of 2017 and 2018, tax compliance and preparation fees totaled $1.4Mapproximately $2 million and tax advisory fees totaled $1.1M, and in 2015, tax compliance and preparationapproximately $1 million. |
| (4) | The aggregate fees totaled $1.6M and taxfor all other services rendered, including for 2017 fees for business advisory fees totaled $0.5M.services. |
PricewaterhouseCoopers also provides services to domestic and international mutual funds and limited partnerships not consolidated by Prudential Financial, but which are managed by Prudential Financial. PricewaterhouseCoopers identified fees related to audit, audit-related, tax and taxall other services paid by these entities of $14M$15 million in 20162018 and $14M$14 million in 2015.2017. The Audit Committee has advised the Board of Directors that in its opinion thenon-audit services rendered by PricewaterhouseCoopers during the most recent fiscal year are compatible with maintaining its independence. PwC has been the Company’s independent auditor since 2001.it became a public company in 2001 and prior to that from 1996. | | | | | 26 | | | | Notice of Annual Meeting of Shareholders and 20172019 Proxy Statement | | | | | 29 |
| | |
| | Item 2—Ratification of the Appointment of the Independent Registered Public Accounting Firm | |
In determining whether to reappoint the independent auditor, the Audit Committee annually considers several factors, including: the length of time the firm has been engaged; the firm’s independence and objectivity; PwC’s capability and expertise in handling the breadth and complexity of Prudential’s global operations, including the expertise and capability of the Lead Audit Partner;lead audit partner; historical and recent performance, including the extent and quality of PwC’s communications with the Audit Committee, and the results of a management survey of PwC’s overall performance; data related to audit quality and performance, including recent Public Company Accounting Oversight BoardPCAOB inspection reports on the firm; and the appropriateness of PwC’s fees, both on an absolute basis and as compared with its peers. In accordance with SEC rules, independent audit partners are subject to rotation requirements limiting their number of consecutive years of service to our Company to no more than five. In 2016, Prudential’s Audit Committee oversaw a rigorousThe process offor selecting a new Lead Audit Partner with PwC. PwC provided a list of qualified potentialthe Company’s lead audit partners. The candidates were interviewedpartner includes Company management and assessed based on their related experience and industry expertise. Interviews were conducted and the Chair met with and interviewed the final candidate. The new Lead Audit Partner selected was approved by the Audit Committee and will assume oversightChair vetting the independent auditor’s candidates. The full Audit Committee is consulted in connection with the final selection of the externallead audit of Prudential Financial effective for the 2017 audit.partner. AUDIT COMMITTEEPRE-APPROVAL POLICIES AND PROCEDURES The Audit Committee has established a policy requiring itspre-approval of all audit and permissiblenon-audit services provided by the independent auditor. The policy identifies the guiding principles that must be considered by the Audit Committee in approving services to ensureso that the independent auditor’s independence is not impaired; describes the Audit, Audit-Related, Tax and All Other services that may be provided and thenon-audit services that may not be performed; and sets forth thepre-approval requirements for all permitted services. The policy provides for the generalpre-approval of specific types of Audit, Audit-Related and Tax services and a limited fee estimate range for such services on an annual basis. The policy requires specificpre-approval of all other permitted services. The independent auditor is required to report periodically to the Audit Committee regarding the extent of services provided in accordance with theirpre-approval and the fees for the services performed to date. The Audit Committee’s policy delegates to its Chair the authority to address requests forpre-approval of services with fees up to a maximum of $250,000 between Audit Committee meetings if the Company’s Chief Auditor deems it reasonably necessary to begin the services before the next scheduled meeting of the Audit Committee, and the Chair must report anypre-approval decisions to the Audit Committee at its next scheduled meeting. The Audit Committee may not delegate to management the Audit Committee’s responsibility topre-approve permitted services of the independent auditor. All Audit, Audit-Related, Tax and All Other services described above were approved by the Audit Committee before services were rendered. The Board of Directors recommends that shareholders vote“FOR” ratification of the appointment of PricewaterhouseCoopers as the Company’s Independent Auditor for 2017.2019. ENHANCING COMMUNICATION THROUGH AUDIT COMMITTEE REPORTING The Center for Audit Quality and a group of nationally recognized U.S. corporate governance and policy organizations jointly released a paper entitled “Enhancing the Audit Committee Report: A Call to Action,” which encouraged audit committees of public companies to proactively consider strengthening their public disclosures to more effectively convey the critical work of audit committees to investors and stakeholders. Prudential was featured as an example of a company exhibiting voluntary practices strengthening audit committee disclosures. | | | | | | | | 30 | | | | | Notice of Annual Meeting of Shareholders and 20172019 Proxy Statement | | | | 27 | |
| | |
| | Item 2—Ratification of the Appointment of the Independent Registered Public Accounting Firm | |
REPORT OF THE AUDIT COMMITTEE Threenon-management independent directors comprise the Audit Committee. The Committee operates under a written charter adopted by the Board. In addition, the Board of Directors has determined that all of our Audit Committee members, Messrs. Paz and Scovanner and Ms. Hund-Mejean, satisfy the financial expertise requirements of the NYSE and have the requisite experience to be designated an audit committee financial expert as that term is defined by rules of the SEC. Management is responsible for the preparation, presentation and integrity of the financial statements of Prudential Financial and for maintaining appropriate accounting and financial reporting policies and practices, and internal controls and procedures designed to assure compliance with accounting standards and applicable laws and regulations. Prudential Financial’s independent registered public accounting firm (independent auditor),auditor, PricewaterhouseCoopers, is responsible for auditing the consolidated financial statements of Prudential Financial and expressing an opinion as to their conformity with generally accepted accounting principles, as well as expressing an opinion on the effectiveness of internal control over financial reporting in accordance with the requirements of the Public Company Accounting Oversight Board (“PCAOB”). In performing its oversight function, the Audit Committee reviewed and discussed the audited consolidated financial statements of Prudential Financial as of and for the year ended December 31, 20162018 and Management’s Annual Report on Internal Control Over Financial Reporting with management and Prudential Financial’s independent auditor. The Audit Committee also discussed with Prudential Financial’s independent auditor the matters required to be discussed by the independent auditor with the Audit Committee under the rules adopted by the PCAOB. The Audit Committee received from the independent auditor the written disclosures and the letterletters required by applicable requirements of the PCAOB regarding the independent auditor’s communications with the Audit Committee concerning independence, and has discussed with the independent auditor its independence. The Audit Committee has discussed with, and received regular status reports from, Prudential Financial’s Chief Auditor and independent auditor on the overall scope and plans for their audits of Prudential Financial, including their scope and plans for evaluating the effectiveness of internal control over financial reporting. The Audit Committee meets with the Chief Auditor and the independent auditor, with and without management present, to discuss the results of their respective audits, in addition to private meetings with the Chief Financial Officer, Chief Risk Officer, General Counsel, Chief Actuary and Chief Compliance Officer. In determining whether to reappoint PricewaterhouseCoopers as Prudential Financial’s independent auditor, the Audit Committee took into consideration a number of factors, including the length of time the firm has been engaged, the firm’s independence and objectivity, PwC’s capability and expertise in handling the breadth and complexity of Prudential’s global operations, including the expertise and capability of the Lead Audit Partner, historical and recent performance, including the extent and quality of PwC’s communications with the Audit Committee, and the results of a management survey of PwC’s overall performance, data related to audit quality and performance, including recent PCAOB inspection reports on the firm, and the appropriateness of PwC’s fees, both on an absolute basis and as compared with its peers. In addition, the Audit Committee reviewed and amended its Charter and received reports as required by its policy for the receipt, retention and treatment of financial reporting concerns received from external and internal sources.
Based on the reports and discussions described in this report and subject to the limitations on the roles and responsibilities of the Audit Committee referred to above and in its Charter, the Audit Committee recommended to the Board of Directors that the audited consolidated financial statements of Prudential Financial and Management’s Annual Report on Internal Control Over Financial Reporting be included in the Annual Report on Form10-K for the fiscal year ended December 31, 20162018 for filing with the SEC. THE AUDIT COMMITTEE Douglas A. Scovanner (Chair) Martina Hund-Mejean George Paz | | | | | 28 | | | | Notice of Annual Meeting of Shareholders and 20172019 Proxy Statement | | | | | 31 |
Item 3–Advisory Vote to Approve Named Executive Officer Compensation The Board is committed to excellence in governance and recognizes theour shareholders’ interest our shareholders have in our executive compensation program. As a part of that commitment, and in accordance with SEC rules, our shareholders are being asked to approve anon-binding advisory resolution on the compensation of our named executive officers, as reported in this Proxy Statement. This proposal, commonly known as a “Say on Pay” proposal, gives shareholders the opportunity to endorse or not endorse our 20162018 executive compensation program and policies for our named executive officers through the following resolution: RESOLVED, that the shareholders of Prudential approve, on an advisory basis, the compensation of the Company’s named executive officers set forth in the Compensation Discussion and Analysis, the Summary Compensation Table and the related compensation tables and narrative in this Proxy Statement. This vote is not intended to address any specific item of compensation, but rather our overall compensation policies and practices relating to our named executive officers. Accordingly, your vote will not directly affect or otherwise limit any existing compensation or award arrangement of any of our named executive officers. Because your vote is advisory, it will not be binding upon the Board. The Board will, however, as it has done in prior years, take into account the outcome of the “Say on Pay” vote when considering future compensation arrangements. TheAt the 2017 Annual Meeting, shareholders approved, on an advisory basis, holding “Say on Pay” votes annually, and the Board has adopted a policy providing for annual “Say on Pay” votes. Accordingly, subject to the outcome of Item 4 and the decision of the Board, the next “Say on Pay” vote will occur in 2018.2020.
The Board of Directors recommends that shareholders vote“FOR” the advisory vote to approve our named executive officer compensation. Item 4–Advisory Vote on the Frequency of
Future Advisory Votes to Approve Named
Executive Officer Compensation
As described in Item 3, our shareholders are being asked to vote to approve the compensation of our named executive officers, as reported in this Proxy Statement. In accordance with SEC rules, Item 4 gives you the opportunity to cast anon-binding vote on how often the Company should include an advisory vote on named executive officer compensation in its proxy materials for future annual or other meetings for which the Company must include executive compensation information. Shareholders may vote to have the advisory vote on executive compensation every year, every two years, or every three years. Shareholders may also abstain from voting.
The Board believes that these votes should occur every year so shareholders may annually express their views on our executive compensation program. The Company has been providing an advisory vote on executive compensation on an annual basis. The Board values the opportunity to receive feedback and will continue to consider the outcome of these votes in making executive compensation decisions.
The Board of Directors recommends that shareholders vote For“EVERY YEAR” on the frequency of future advisory votes to approve named executive officer compensation.
| | | | | | | | 32 | | | | | Notice of Annual Meeting of Shareholders and 20172019 Proxy Statement | | | | 29 | |
Item 5–4–Shareholder Proposal Regarding an Independent Board ChairmanRight to Act by Written Consent
In accordance with SEC rules, we have set forth below a shareholder proposal, along with the supporting statement of the shareholder proponent. The Company is not responsible for any inaccuracies it may contain. The shareholder proposal is required to be voted on at our Annual Meeting only if properly presented. As explained below, our Board unanimously recommends that you vote“AGAINST” the shareholder proposal. John Chevedden, 2215 Nelson Avenue, No. 205, Redondo Beach, California, 90278, beneficial owner of 10050 shares of Common Stock, is the proponent of the following shareholder proposal. The proponent has advised us that a representative will present the proposal and related supporting statement at the Annual Meeting. Independent Board ChairmanRight to Act by Written Consent
Resolved, Shareholders request that our Boardboard of Directors to adoptdirectors undertake such steps as policy, and amend our governing documents asmay be necessary to requirepermit written consent by shareholders entitled to cast the Chairminimum number of votes that would be necessary to authorize the action at a meeting at which all shareholders entitled to vote thereon were present and voting. This written consent is to be consistent with applicable law and consistent with giving shareholders the fullest power to act by written consent consistent with applicable law. This includes shareholder ability to initiate any topic for written consent consistent with applicable law. Hundreds of major companies enable shareholder action by written consent. Taking action by written consent in place of a meeting is a means shareholders can use to raise important matters outside the normal annual meeting cycle. This proposal topic won majority shareholder support at 13 major companies in a single year. This included 67%-support at both Allstate and Sprint. Hundreds of major companies enable shareholder action by written consent. This proposal topic would have received a vote still higher than 67% at Allstate and Sprint if all shareholders at Allstate and Sprint had access to independent proxy voting advice. More than 100 Fortune 500 companies provide for shareholders to call special meetings and to act by written consent. Written consent is a means to elect a director who could focus on the wisdom of stock repurchases: Approved share repurchase plan of up to $1.5 Billion of common stock starting January 1, 2018 Approved share repurchase increase of $500 Million of common stock August 2016 There is a concern about share repurchases like the above. Stock buybacks can be a sign of short-termism for executives—sometimes boosting share price without boosting the underlying value, profitability, or ingenuity of the company. A dollar spent repurchasing a share is a dollar that cannot be spent on new equipment, an acquisition, entry into a new market or anything else. Written consent is a means to elect a director who could focus on avoiding reoccurrences of events like these: Putative Class Action Lawsuit over alleged improper charges on universal life policies holders to “cure defaults and/or reinstate lapses,” Pruco Life Insurance Company May 2018 Regulator launched investigation over alleged role in Wells Fargo’s fraudulent accounts December 2017 Criticism over alleged role in offshore tax havens April 2017 The expectation is that, once this proposal is adopted, shareholders would not need to make use of this right of written consent because its mere existence will act as a guardrail to help ensue that our company is well supervised by the Board of Directors whenever possible,and management. Our Directors and management will want to avoid shareholder action by written consent and will thus be an independent member of the Board. The Board would have the discretion to phasemore alert in this policy for the next CEO transition, implemented so it does not violate any existing agreement. If the Board determines that a Chair who was independent when selected is no longer independent, the Board shall select a new Chair who satisfies the requirements of the policy within a reasonable amount of time. Compliance with this policy is waived if no independent director is available and willing to serve as Chair. This proposal requests that all the necessary steps be taken to accomplish the above. Caterpillar reversed itself by naming an independent board chairman in October 2016 after Caterpillar opposed a shareholder proposal for an independent board chairman at its June 2016 annual meeting. Wells Fargo also reversed itself and named an independent board chairman in October 2016.
According to Institutional Shareholder Services 53% of the Standard & Poors 1,500 firms separate these 2 positions—“2015 Board Practices,” April 12, 2015. This proposal topic won 50%-plus support at 5 major U.S. companies in 2013 including 73%-support at Netflix.
It is the responsibility of the Board of Directors to protect shareholders’ long-term interests by providing independent oversight of management. By setting agendas, priorities and procedures, the Chairman is critical in shaping the work of the Board.
A board of directors is less likely to provide rigorous independent oversight of management if the Chairman is also the CEO, as is the case with our Company. Having a board chairman who is independent of management is a practice that will promote greater management accountability to shareholders and lead to a more objective evaluation of management.
According to the Millstein Center for Corporate Governance and Performance (Yale School of Management), “The independent chair curbs conflicts of interest, promotes oversight of risk, manages the relationship between the board and CEO, serves as a conduit for regular communication with shareowners, and is a logical next step in the development of an independent board.”
A number of institutional investors said that a strong, objective board leader can best provide the necessary oversight of management. Thus, the California Public Employees’ Retirement System’s Global Principles of Accountable Corporate Governance recommends that a company’s board should be chaired by an independent director, as does the Council of Institutional Investors. An independent director serving as chairman can help ensure the functioning of an effective board.avoiding poor performance.
Please vote yes:Right to enhance shareholder value: Independent Board Chairman—Act by Written Consent—Proposal 54 | | | | | 30 | | | | Notice of Annual Meeting of Shareholders and 20172019 Proxy Statement | | | | | 33 |
| | |
| | Item 5—4–Shareholder Proposal Regarding an Independent Board ChairmanRight to Act by Written Consent
| |
Board of Directors’ Statement in Opposition to the Proposal Your Board recommends a vote against this proposal because it believes that the written consent process, as required by the proposal, is less transparent and less democratic than a shareholder meeting and deprives shareholders of a forum for discussion or the opportunity for them to make inquiries about proposed actions. Matters that are sufficiently important to require shareholder approval should be communicated in advance so they can be considered and voted upon by all shareholders. This proposal would allow a group of shareholders to take action by written consent without prior communication to all shareholders of the proposed actions or the reasons for the actions. We believe this proposal disenfranchises shareholders who would not have the opportunity to participate in the proposed process. Permitting shareholder action by written consent has the potential to create confusion, and the Board does not believe it is appropriate for a widely held public company. Our Board believes that every shareholder should have the opportunity to consider and vote upon shareholder actions. Our shareholders have the right to call a special meeting at a 10% threshold. This right, as well as our established shareholder communication and engagement mechanisms, provides shareholders the opportunity to raise important matters outside the annual meeting process. The Company is committed to good corporate governance, which helps us compete more effectively, sustain our success and build long-term shareholder value. The Company has a strong governance structure in place, and the Board’s philosophy and policies are responsive to shareholders. In addition to the unrestricted right for shareholders to call special meetings at a 10% threshold, the Company has many other governance provisions in place that empower shareholders, including: a majority voting standard in uncontested director elections; no Shareholder Rights Plan; an annually elected Board; no supermajority voting provisions; independent board leadership, including a strong Lead Independent Director and strong committee chairs; and Requiring that all shareholder business be acted upon at a meeting helps to confirm complete information is presented to shareholders to obtain their approval and is more democratic. The Board believes that the risk of abuse associated with the right to act by written consent, including bypassing procedural protections that offer transparency and advance notice, both of which are afforded with a shareholder meeting, make this proposal not in the best interest of our shareholders forall shareholders. In summary, the Board to havebelieves the flexibility to determine the best person to serve as Board Chair, whether that personadoption of this proposal is an independent director or the CEO. Every year, the Governance Committee reviews and makes a recommendation on the appropriate governance framework for Board leadership. The Committee takes into consideration governance best practices, the facts and circumstancesunnecessary because of our Boardcommitment to good corporate governance and feedback that we receive from our shareholders. Specifically, our Board proactively asks for feedback from ourthe right of shareholders and regularly meets with our shareholders in various settings. In 2016, independent directors, as well asto call a special meeting at a 10% threshold.Furthermore, the Company’s Chief Governance Officer, engaged with many investors on the issue of our Board leadership structure, among other things, and have presented their feedback to the Board as part of its decision-making process on the appropriate Board leadership structure going forward.
The Governance Committee has most recently determined that Board leadership is provided through the combination of a unified Chair and CEO, a clearly defined and significant Lead Independent Director role, active and strong committee chairs, and independent-minded, skilled, engaged, diverse and committed directors.
Our Board believes that its current structurethe written consent proposal would circumvent the protections, procedural safeguards and governance allows it to provide effective oversight of management. Specifically, we have a strong Lead Independent Director with significant responsibilities that are described in detail in this Proxy Statement, including approval of all Board agendas and information sent to the Board, shareholder engagement, oversight of the annual Board evaluation process by an independent third party, Board refreshment and succession planning, and guiding the Board’s overall governance processes. We also refer you to the Lead Independent Director’s letter which is contained in this Proxy Statement, as well as the Lead Independent Director’s video and Lead Independent Director Charter at www.prudential.com/governance. Mr. Krapek’s skills, experience, commitment and the time he devotes to serve his role all make him well qualified to serve as our Lead Independent Director.
Our independent directors meet regularly in executive sessions, at the beginning and end of each Board meeting. These are chaired by our Lead Independent Director with no member of management present. Independent directors use these executive sessions to discuss matters of concern, as well as evaluations of the CEO and senior management, management and Board successions, matters to be included on Board agendas, and additional information the Board would like management to provide to them, as well as other relevant matters.
The Chairs and all members of the Board committees are strong, independent directors. These Chairs shape the agenda and information presented to their committees. Oversight of critical issues within these committees is owned by the independent directors.
All directors have full accessadvantages provided to all members of management and all employees on a confidential basis.
The proposed policy would unduly impair the Board’s flexibility to annually elect the individual it deems best suited to serve as Board Chair. Shareholders of Prudential are best served when the Board has the flexibility to elect the individual it deems best suited to serve as Board Chair at any particular time, depending on the circumstances. Our Board believes that a clearly defined and significant Lead Independent Director role, independent and strong committee chairs, experienced, diverse and committed directors, and frequent executive sessions provide a framework for effective direction and oversightshareholders by the Board.shareholder meetings.
THEREFORE, YOUR BOARD RECOMMENDS THAT YOU VOTE“AGAINST” THIS PROPOSAL. | | | | | | | | 34 | | | | | Notice of Annual Meeting of Shareholders and 20172019 Proxy Statement | | | | 31 | |
Voting Securities and Principal Holders Beneficial Ownership The following table shows all entities that are the beneficial owners of more than 5% of the Company’s Common Stock: | | | | | | | | | Name and Address of Beneficial Owner | | Amount and Nature | | | Percent of Class | | BlackRock, Inc.
55 East 52nd Street, New York, NY 10055
| | | 31,440,194 | (1) | | | 7.3% | | The Vanguard Group
100 Vanguard Boulevard, Malvern, PA 19355
| | | 29,303,986 | (2) | | | 6.81% | |
| | | | | | | | | | | | Name and Address of Beneficial Owner | | Amount and Nature | | | Percent of Class | | The Vanguard Group 100 Vanguard Boulevard, Malvern, PA 19355 | | | 32,028,683 | (1) | | | 7.75% | | BlackRock, Inc. 55 East 52nd Street, New York, NY 10055 | | | 27,744,199 | (2) | | | 6.70% | | Wellington Management Group LLP 280 Congress Street, Boston, MA 02210 | | | 20,906,480 | (3) | | | 5.06% | |
| (1) | Based on information as of December 31, 20162018 contained in a Schedule 13G/A filed with the SEC on January 25, 2017February 12, 2019 by The Vanguard Group. The Schedule 13G/A indicates that The Vanguard Group has sole investment power with respect to 31,457,136 of the shares, shared investment power with respect to 571,547 of the shares, sole voting power with respect to 481,973 of the shares, and shared voting power with respect to 98,092 of the shares. |
| (2) | Based on information as of December 31, 2018 contained in a Schedule 13G/A filed with the SEC on February 11, 2019 by BlackRock, Inc. The Schedule 13G/A indicates that BlackRock, Inc. has sole dispositiveinvestment power with respect to all of the shares, sole voting power with respect to 26,485,20222,872,236 of the shares, and shared dispositiveinvestment and voting power with respect to none of the shares. |
(2)(3) | Based on information as of December 31, 20162018 contained in a Schedule 13G/A13G filed with the SEC on February 13, 201712, 2019 by The Vanguard Group.Wellington Management Group LLP. Wellington Group Holdings LLP, and Wellington Investment Advisors Holdings LLP (the “Wellington Group”). The Schedule 13G/A13G indicates that The Vanguardthe Wellington Group has sole dispositiveshared investment power with respect to 28,546,218all of the shares, shared dispositive power with respect to 757,768 of the shares, sole voting power with respect to 686,194 of the shares, and shared voting power with respect to 78,8904,855,934 of the shares, and sole investment and voting power with respect to none of the shares. |
To our knowledge, except as noted above, no person or entity is the beneficial owner of more than 5% of our Common Stock. The following table sets forth information regarding the beneficial ownership of our Common Stock as of March 10, 2017,8, 2019, by: each director and NEO; and
all directors and executive officers of the Company as a group.
Voting Securities and Principal Holders
The following table sets forth information regarding the beneficial ownership of our Common Stock as of March 10, 2017, by:
each Director, Director Nominee and Named Executive Officer, and all current Directors and Executive officers of Prudential Financial as a group. | | | Name of Beneficial Owner | | Common Stock | | | Number of shares
Subject to
Exercisable Options | | | Total Number of Shares
Beneficially Owned1 | | | Director Deferred Stock
Units / Additional
Underlying Units2,3,4 | | | Total Shares
Beneficially Owned
Plus Underlying
Units | | | Common Stock | | Number of shares
Subject to
Exercisable Options | | | Total Number of Shares
Beneficially Owned(1) | | | Director Deferred Stock
Units / Additional
Underlying Units9(2),(3),(4) | | | Total Shares
Beneficially Owned
Plus Underlying
Units | | | | Thomas J. Baltimore, Jr. | | | 250 | | | | | | 250 | | | | 37,710 | | | | 37,960 | | | | 250 | | | | | | 250 | | | | 47,635 | | | | 47,885 | | | Gilbert F. Casellas | | | 500 | | | | | | 500 | | | | 29,744 | | | | 30,244 | | | | 500 | | | | | | 500 | | | | 31,152 | | | | 31,652 | | | James G. Cullen | | | 2,033 | | | | | | 2,033 | | | | 43,896 | | | | 45,929 | | | | Martina Hund-Mejean | | | 128 | | | | | | 128 | | | | 15,505 | | | | 15,633 | | | | 128 | | | | | | 128 | | | | 19,577 | | | | 19,705 | | | Karl J. Krapek | | | 1,007 | | | | | | 1,007 | | | | 44,599 | | | | 45,606 | | | | 1,000 | | | | | | 1,000 | | | | 43,354 | | | | 44,354 | | | Peter R. Lighte | | | 80 | | | | | | 80 | | | | 4,180 | | | | 4,260 | | | | 80 | | | | | | 80 | | | | 7,475 | | | | 7,555 | | | George Paz | | | 500 | | | | | | 500 | | | | 4,177 | | | | 4,677 | | | | 500 | | | | | | 500 | | | | 7,472 | | | | 7,972 | | | Sandra Pianalto | | | 200 | | | | | | 200 | | | | 3,765 | | | | 3,965 | | | | 451 | | | | | | 451 | | | | 7,033 | | | | 7,484 | | | Christine A. Poon | | | 11,583 | | | | | | 11,583 | | | | 13,411 | | | | 24,994 | | | | 11,583 | | | | | | 11,583 | | | | 13,726 | | | | 25,309 | | | Douglas A. Scovanner | | | 12,000 | | | | | | 12,000 | | | | 11,559 | | | | 23,559 | | | | 12,000 | | | | | | 12,000 | | | | 15,349 | | | | 27,349 | | | Michael A. Todman | | | 450 | | | | | | 450 | | | | 4,180 | | | | 4,630 | | | Michael A.Todman | | | | 450 | | | | | | 450 | | | | 7,475 | | | | 7,925 | | | John R. Strangfeld | | | 287,821 | | | | 814,369 | | | | 1,102,190 | | | | 328,995 | | | | 1,431,185 | | | | 307,094 | 5 | | | 827,205 | | | | 1,134,299 | | | | 243,908 | | | | 1,378,207 | | | Mark B. Grier | | | 364,887 | | | | 334,973 | | | | 699,860 | | | | 231,322 | | | | 931,182 | | | | 405,481 | | | | 482,449 | | | | 887,930 | | | | 202,705 | | | | 1,090,635 | | Charles F. Lowrey | | | | 56,982 | | | | 159,230 | | | | 216,212 | | | | 171,695 | | | | 387,907 | | | Robert Falzon | | | 44,987 | | | | 34,434 | | | | 79,421 | | | | 112,154 | | | | 191,575 | | | | 64,809 | | | | 106,490 | | | | 171,299 | | | | 135,787 | | | | 307,086 | | | Charles F. Lowrey | | | 46,358 | | | | 325,337 | | | | 371,695 | | | | 142,313 | | | | 514,008 | | | | Stephen Pelletier | | | 7,051 | | | | 0 | | | | 7,051 | | | | 166,861 | | | | 173,912 | | | | 8,596 | | | | 32,378 | | | | 40,974 | | | | 200,841 | | | | 241,815 | | | All directors and executive officers as a group (22 persons) | | | 973,268 | | | | 1,865,564 | | | | 2,838,832 | | | | 1,582,788 | | | | 4,421,620 | | | Scott Sleyster | | | | 49,885 | | | | 148,552 | | | | 198,437 | | | | 153,925 | | | | 352,362 | | Kenneth Tanji | | | | 16,824 | | | | 64,573 | | | | 81,397 | | | | 40,744 | | | | 122,141 | | All directors and executive officers as a group (23 persons) | | | | 1,040,781 | | | | 2,050,204 | | | | 3,090,985 | | | | 1,510,816 | | | | 4,601,801 | |
| (1) | Individual directors and executive officers as well as all directors and executive officers as a group beneficially own less than 1% of the shares of Common Stock outstanding, as of March 10, 2017.8, 2019. |
| (2) | Includes the following number of shares or share equivalents in deferred units through the Deferred Compensation Plan for Non-Employee Directors and the Prudential Insurance Company of America Deferred Compensation Plan, as to which no voting or investment power exists: Mr. Baltimore, 37,710;47,635; Mr. Casellas, 29,744; Mr. Cullen, 43,896;31,152; Ms. Hund-Mejean, 15,505;19,577; Mr. Krapek,44,599;Krapek, 43,354; Mr. Lighte, 4,180;7,475; Mr. Paz, 4,177;7,472; Ms. Pianalto, 3,765;7,033; Ms. Poon, 13,411;13,726; Mr. Scovanner, 11,559;15,349; Mr. Todman, 4,180;7,475; Mr. Strangfeld, 41,598;10,935; Mr. Pelletier, 34,166; and Mr. Pelletier, 31,847.Sleyster, 80,111. |
| (3) | Includes the following shares representing the target number of shares to be received upon the attainment of ROE goals under the performance share program described under “Compensation Discussion and Analysis”: Mr. Strangfeld, 101,030;83,821; Mr. Grier, 81,554;68,156; Mr. Lowrey, 52,586; Mr. Falzon, 38,952;42,434; Mr. Lowrey, 50,389;Pelletier, 39,757; Mr. Sleyster, 26,007; and Mr. Pelletier, 46,103.Tanji, 12,203. |
| (4) | Includes the following unvested stock options: Mr. Strangfeld, 186,367;149,152; Mr. Grier,149,768;Grier, 134,549; Mr. Falzon,73,202;Lowrey, 119,109; Mr. Lowrey,91,924;Falzon, 93,353; Mr. Pelletier, 126,918; Mr. Sleyster, 47,807; and Mr. Pelletier, 88,911.Tanji, 28,541. |
| (5) | Includes 4,400 shares held by the John and Mary K. Strangfeld Foundation. |
| | | | | | | | Notice of Annual Meeting of Shareholders and 2019 Proxy Statement | | | | | 35 |
| | |
| | Voting Securities and Principal Holders | |
Compliance Withwith Section 16(a) of the Exchange Act Each director,Director and executive officer of the Company and any greater than 10% beneficial owner of Common Stock is required to report to the SEC, by a specified date, his or her transactions involving our Common Stock. Based solely on a review of the copies of reports furnished to the Company and written representations that no other reports were required to be filed, the Company believes that for transactions during 20162018 all reports required by Section 16(a) were timely filed. Prior to 2018, six reports for Thomas Baltimore, Director, reporting an inadvertent purchase of 65 shares and inadvertent sales of a total of 315 shares were not timely filed due to an oversight by the broker effecting the transactions without any knowledge of Mr. Baltimore. | | | | | 32 | | | 36 | | | | | Notice of Annual Meeting of Shareholders and 20172019 Proxy Statement |
Compensation of Directors The Corporate Governance and Business Ethics Committee reviews the compensation of ournon-employee directors periodically (generally every three years) and recommends changes to the Board when it deems appropriate. For December 2018, our Non-Executive Chairman, John Strangfeld, was paid $125,000 for his service on the Board as anon-employee. It is expected that he will receive $375,000 for his service through April 5, 2019. The following table describes the components of thenon-employee directors’ compensation for 2016:2018: | | | | | Compensation Element | | Director Compensation Program | Annual Cash Retainer | | $150,000, which may be deferred, at the director’s option | Annual Equity Retainer | | $150,000 in restricted stock units that vest after one year (or, if earlier, on the date of the next Annual Meeting) | Board and Committee Fees | | None | Chair Fee | | $35,000 for the Audit and Risk Committees $30,000 for the Compensation Committee $20,000 for all other committees*committees(1) | Lead Independent Director Fee | | $50,000 | Meeting Fee for members of the Company’s Community ResourcesCorporate Social Responsibility Oversight Committee**Committee(2) | | $1,250 per meeting | New Director Equity Award(one-time grant) | | $150,000 in restricted stock units that vest after one year | Stock Ownership Guideline | | Ownership of Common Stock or deferred stock units that have a value equivalent to six times the annual cash retainer to be satisfied within six years of joining the Board***Board(3) |
*(1) | Includes other standing committees and anynon-standing committee of the Board that may be established from time to time, but excluding the Executive Committee. |
**(2) | This is a committee comprised of members of management and the Board. This Committee typically meets on a separate day following the Board and Board committee meetings. Thenon-employee directors on this Committeecommittee currently consist of Mr. Casellas, Ms. Pianalto and Ms. Poon. The Community ResourcesCorporate Social Responsibility Oversight Committee met three times in 2016.2018. |
***(3) | As of December 31, 2016,2018, each of ournon-employee directors satisfied this guideline, with the exception of Ms. Pianalto, who joined the Board in July 2015, and Messrs. Lighte, Paz and Todman, who joined the Board in March 2016,within the last five years, each of whom has six years to satisfy the guideline sinceafter he or she joined the Board. For purposes of the stock ownership guideline, once anon-employee director satisfies his or her stock ownership level, the director will be deemed to continue to satisfy the guideline without regard to fluctuation in the value of the Common Stock owned by the director. |
The Company maintainsWe maintain a Deferred Compensation Plan forNon-Employee Directors (the “Plan”). Since 2011, 50% of the annual Board and committee retainer has been awarded in restricted stock units that vest after one year (or if earlier, on the date of the next Annual Meeting). Anon-employee director can elect to invest the cash portion of his or her retainer and fees and equity retainer upon vesting in accounts under the Plan that replicate investments in either shares of our Common Stock or the Fixed Rate Fund, which accrues interest in the same manner as funds invested in the Fixed Rate Fund offered under the Prudential Employee Savings Plan (“PESP”). TheAs elected by the director, the Plan provides for distributions to commence upon or following termination of Board service or while a director remains on the Board.
Each director receives dividend equivalents on the restricted stock units contained in his or her deferral account under the Plan, which are equal in value to the dividends paid on our Common Stock. The dividend equivalents credited to the account are then reinvested in the form of additional sharestock units. Under theour director compensation program, if anon-employee director satisfies the stock ownership guideline, the restricted stock units granted as the annual equity retainer are payable upon vesting in cash or shares of our Common Stock (at the director’s option), and may be deferred beyond vesting at the director’s election. If a director does not satisfy the stock ownership guideline, the restricted stock units are automatically deferred until termination of Board service. DIRECTOR STOCK OWNERSHIP GUIDELINE Each director is expected, within six years of joining the Board, to own Common Stock or deferred stock units that have a value equivalent to six times his or her annual cash retainer. | | | | | | | | Notice of Annual Meeting of Shareholders and 20172019 Proxy Statement | | | | 33| | | 37 |
| | |
| | Compensation of Directors | |
20162018 Director Compensation Table
Mr. Strangfeld retired as CEO on November 30, 2018, but remains on the Board as Non-Executive Chairman until April 5, 2019. As a member of the Board and an employee, he did not receive director compensation. As anon-employee Non-Executive Chairman, he received $125,000 for his service in December 2018. This amount is included in the 2018 Summary Compensation Table for Mr. Strangfeld under “All Other Compensation.” | | | | | | | | | | | | | | | | | | | | Fees Earned or Paid in | | | | | | | | | Name | | Cash($) | | | Stock Awards($)(1) | | | All Other Compensation($)(2) | | | Total($) | | | Thomas J. Baltimore | | | 170,000 | | | | 150,000 | | | | | | | | 320,000 | | | Gordon M. Bethune | | | 62,500 | | | | 0 | | | | | | | | 62,500 | | | Gilbert F. Casellas | | | 173,750 | | | | 150,000 | | | | | | | | 323,750 | | | James G. Cullen | | | 150,000 | | | | 150,000 | | | | 5,000 | | | | 305,000 | | | Constance J. Horner2 | | | 63,750 | | | | 0 | | | | 25,000 | | | | 88,750 | | | Martina Hund-Mejean | | | 150,000 | | | | 150,000 | | | | 5,000 | | | | 305,000 | | | Karl J. Krapek | | | 265,000 | | | | 150,000 | | | | 5,000 | | | | 420,000 | | | Peter R. Lighte3 | | | 125,000 | | | | 300,000 | | | | 5,000 | | | | 430,000 | | | George Paz3 | | | 125,000 | | | | 300,000 | | | | 5,000 | | | | 430,000 | | | Sandra Pianalto | | | 152,500 | | | | 150,000 | | | | 5,000 | | | | 307,500 | | | Christine A. Poon | | | 173,750 | | | | 150,000 | | | | | | | | 323,750 | | | Douglas A. Scovanner | | | 185,000 | | | | 150,000 | | | | | | | | 335,000 | | | Michael A. Todman3 | | | 125,000 | | | | 300,000 | | | | 5,000 | | | | 430,000 | |
| | | | | | | | | | | | | | | | | | | | Fees Earned or Paid in | | | | | | | | | | | | | Name | | Cash($) | | | Stock Awards($)(1) | | | All Other Compensation($)(2) | | | Total($) | | Thomas J. Baltimore | | | 255,000 | | | | 150,000 | | | | | | | | 405,000 | | Gilbert F. Casellas | | | 173,750 | | | | 150,000 | | | | 5,000 | | | | 328,750 | | Martina Hund-Mejean | | | 150,000 | | | | 150,000 | | | | | | | | 300,000 | | Karl J. Krapek | | | 180,000 | | | | 150,000 | | | | 5,000 | | | | 335,000 | | Peter R. Lighte | | | 150,000 | | | | 150,000 | | | | 10,000 | 3 | | | 310,000 | | George Paz | | | 150,000 | | | | 150,000 | | | | 5,000 | | | | 305,000 | | Sandra Pianalto | | | 153,750 | | | | 150,000 | | | | 5,000 | | | | 308,750 | | Christine A. Poon | | | 172,500 | | | | 150,000 | | | | | | | | 322,500 | | Douglas A. Scovanner | | | 185,000 | | | | 150,000 | | | | | | | | 335,000 | | Michael A. Todman | | | 150,000 | | | | 150,000 | | | | 5,000 | | | | 305,000 | |
| (1) | Represents amounts that are in units of our Common Stock. The amounts reported represent the aggregate grant date fair value of the restricted stock units granted during the fiscal year, as calculated under the Financial Accounting Standards Board’s Accounting Codification Topic 718. Under ASC Topic 718, the grant date fair value is calculated using the closing market price of our Common Stock on the date of grant, which is then recognized, subject to market value changes, over the requisite service period of the award. As of December 31, 2016, theThe aggregate balance in each of thenon-employee directors’ accounts in the Deferred Compensation Plan denominated in units (which includes all deferrals from prior years)years and theyear-end valuesearned units deferred in 2018) and their value were as follows: Mr. Baltimore: 37,71047,635 and $3,924,103;$3,884,634; Mr. Casellas: 29,74431,152 and $3,095,161; Mr. Cullen: 43,896 and $4,567,818;$2,540,446; Ms. Hund-Mejean: 15,50519,577 and $1,613,450;$1,596,504; Mr. Krapek: 48,98743,354 and $5,097,587;$3,535,519; Mr. Lighte : 4,180Lighte: 7,475 and $434,971;$609,586; Mr. Paz: 4,1777,472 and $434,659;$609,342; Ms. Pianalto: 3,7657,033 and $391,786;$573,541; Ms. Poon: 13,41113,726 and $1,395,549;$1,119,355; Mr. Scovanner 11,559Scovanner: 15,349 and $1,202,830;$1,251,711; and Mr. Todman: 4,1807,475 and $434,971.$609,586. |
| (2) | Represents amounts for 20162018 matching charitable contributions; and with respect to Ms. Horner, includes a $25,000 donation in her honor for her service on the Company’s Community Resources Oversight Committee.contributions. |
| (3) | Messrs. Lighte, Paz,Both Mr. Lighte’s 2017 and Todman each received grants2018 contributions were matched in 2018. |
| | | | | | | | 38 | | | | | Notice of restricted stock units valued at $150,000 upon joining the Board in March 2016.Annual Meeting of Shareholders and 2019 Proxy Statement |
| | | | | 34  | | | Notice of Annual Meeting of Shareholders and 2017 Proxy Statement |
Compensation Discussion and Analysis In this section, we describe the material components of our executive compensation program for our NEOs, whose compensation is set forth in the 20162018 Summary Compensation Table and other compensation tables contained in this Proxy Statement:Statement. We also provide an overview of our executive compensation philosophy and our executive compensation program. In addition, we explain how and why the Compensation Committee of our Board (the “Committee”) arrived at the specific compensation decisions involving the NEOs for 2018. NAMED EXECUTIVE OFFICERS (NEOS) Charles F. Lowrey, our CEO; John R. Strangfeld, our former CEO (andNon-ExecutiveChairman until April 5, 2019); Kenneth Y. Tanji, our Executive Vice President and Chief Executive Officer;CFO; Robert M. Falzon, our Executive Vice President and Chief Financial Officer;Chairman (and former CFO); Mark B. Grier, our Vice Chairman; Charles F. Lowrey, our Executive Vice President and Chief Operating Officer, International Businesses; and
Stephen Pelletier, our Executive Vice President and Chief Operating Officer, U.S. Businesses; and Scott G. Sleyster, our Executive Vice President and Chief Operating Officer, International Businesses. We also provide an overviewOn December 1, 2018, as part of our executive compensation philosophypreviously announced succession plan:
Charles F. Lowrey, previously our Chief Operating Officer, International Businesses, was named CEO, succeeding John R. Strangfeld; Robert M. Falzon, previously our Executive Vice President and CFO, was named Vice Chairman; Kenneth Y. Tanji, previously our executive compensation program. In addition, we explain howSenior Vice President and why the Compensation CommitteeTreasurer, was named Executive Vice President and CFO; and Scott G. Sleyster, previously our Senior Vice President and Chief Investment Officer, was named Executive Vice President and Chief Operating Officer, International Businesses. Since two individuals served as each of our Board (the “Committee”) arrived at the specific compensation decisions involving theCEO and CFO for a portion of 2018, there are seven NEOs for 2016.2018. Executive Summary
Business Highlights
OUR BUSINESS
We are a global financial services business with $1.264 trillion of assets under management as of December 31, 2016, and with operations in the United States, Asia, Europe, and Latin America. Through our subsidiaries and affiliates, we offer a wide array of financial products and services, including life insurance, annuities, retirement-related services, mutual funds, and investment management. For more information about our business, please see “Business” and “Management’s Discussion and Analysis of Financial Condition and Results of Operations” in our Annual Report on Form10-K filed with the SEC on February 17, 2017.
2016 BUSINESS HIGHLIGHTS
In 2016, global market conditions and uncertainty continued to be factors in the markets in which we operate. Throughout this period, as a result of our steady leadership, we continued to seize opportunities and further differentiate ourselves from the competition. We view 2016 as a successful year for the Company. We continued our focus on capital deployment, disciplined risk management, a balanced business mix and effective execution of our individual business strategies. Consequently, we were able to deliver solid results in a challenging environment of continued low interest rates andfar-reaching regulation of the financial services industry.
We achieved the following accomplishments in 2016:
| | | | | | | | | We reported net income of $4.37 billion, or $9.71 per share of Common Stock in 2016, compared to $5.64 billion, or $12.17 per share, in 2015, based on U.S. generally accepted accounting principles (“GAAP”). Net income for 2015 included a greater benefit from gains driven by market impacts including interest rates than in 2016.
| | 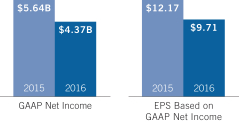
| | | | | We reportedafter-tax adjusted operating income of $4.11 billion, or $9.13 per share of Common Stock in 2016, compared to $4.65 billion or $10.04 per share, in 2015.(1) 2016 after-tax adjusted operating income was negatively affected by actuarial assumption updates, compared to a positive impact in 2015.
| | 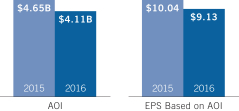
| | |
(1) | Consolidated adjusted operating income (“AOI”) and operating return on average equity are non-GAAP measures of financial performance. Adjusted book value is a non-GAAP measure of financial position. We use earnings per share (“EPS”) based on AOI, operating return on average equity, and adjusted book value as performance measures in our incentive compensation programs. For a discussion of these measures and for reconciliations to the nearest comparable GAAP measures, see Appendix A to this Proxy Statement. |
| | | | | | | | Notice of Annual Meeting of Shareholders and 20172019 Proxy Statement | | | | 35 | |
| | |  | | Compensation Discussion and Analysis: Executive Summary|
| | 39 |
| | | | | | | | | | We reported GAAP book value of $104.91 per share of Common Stock as of December 31, 2016, compared to $92.39 per share as ofyear-end 2015.
Adjusted book value amounted to $78.95 per share of Common Stock as of December 31, 2016, compared to $73.59 per share as ofyear-end 2015.(1)
| | 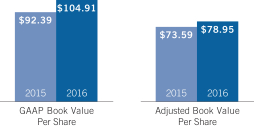
| | |
| | | We reported return on average equity based on income from continuing operations of 8.8% for 2016, compared to 13.3% for 2015.
We reported operating return on average equity of 12% for 2016, compared to 14.5% for 2015 and to the long term target of 13% to 14% we had set in 2011.(1) Our 2016 return on equity reflects solid core performance from our businesses, partly offset by the impact of a number of inherently variable and episodic items including our annual actuarial review. Given the multi-year impact of very low interest rates in our two largest markets, the U.S. and Japan, and the short term impact of strategic investing in our businesses, we have moderated our ROE expectations to 12% to 13% over the near to intermediate term.
| | 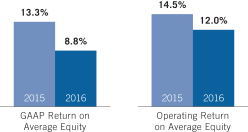
|
| | | | | Assets under management reached $1.264 trillion at December 31, 2016, an increase from $1.184 trillion a year earlier.
| | 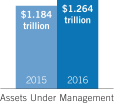 |
| | | We returned a total of $3.2 billion of capital to shareholders in 2016, including $2.0 billion through our share repurchase program and $1.2 billion in the form of Common Stock dividends, compared to a total of $2.1 billion of shareholder distributions in 2015.
| | 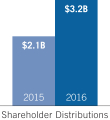 |
(1) | Consolidated adjusted operating income (“AOI”) and operating return on average equity are non-GAAP measures of financial performance. Adjusted book value is a non-GAAP measure of financial position. We use earnings per share (“EPS”) based on AOI, operating return on average equity, and adjusted book value as performance measures in our incentive compensation programs. For a discussion of these measures and for reconciliations to the nearest comparable GAAP measures, see Appendix A to this Proxy Statement. |
Also, in 2016:
We took actions to restructure our Individual Annuities business to reduce capital volatility and improve earnings and cash flow prospects.
We expanded our leading position in the pension risk transfer market, including the completion of approximately $5 billion of new funded cases.
We completed the acquisition of a 40% stake in AFP Habitat, a leading provider of retirement services in Chile.
We reduced total outstanding debt by $1.6 billion.
We believe that maintaining robust capital and liquidity positions provides us with a protective cushion during difficult periods, as well as the ability to pursue new opportunities.
| | | | | 36 | | | Notice of Annual Meeting of Shareholders and 2017 Proxy Statement |
| | | | | Compensation Discussion and Analysis: Executive Summary |
Executive Summary Executive Compensation Highlights The Compensation Committee has instituted a number of changes to our executive compensation program over the last several years to align with evolving competitive and governance practices, respond to feedback from our shareholders, and strengthen the link to performance and rigor of our program. These changes have included: | • | | Strengthening the rigor of our Annual Incentive Program by setting target and maximum awards for senior executives, including the NEOs. | |
| • | | Establishing Long-Term Incentive Target Opportunities for the NEOs. | |
| • | | Requiring deferral of 30% of each NEO’s annual incentive award and 10% of other senior executives’ annual incentive awards into the Book Value Performance Program. | |
| • | | BeginningFor awards granted in 2014, reducing2018, adding a modifier to the maximumPerformance Shares Program that will increase (or decrease) the number of shares and units earned by up to 10% depending on the increase (or decrease) in the representation of diverse persons among our senior management during the 2018 through 2020 performance share award from 150% to 125% of the target level.period. | |
| • | | Increasing our CEO’s stock ownership guideline from five to seven times base salary in 2015.salary. | |
| • | | Expanding the clawback policy for executive officers to cover all incentive-based awards, to address both a material financial restatement or misconduct, and to require | |
| disclosure to shareholders of action taken with regard to compensation recovery following a material financial restatement or misconduct. | |
| • | | Diversifying the performance metrics used to determine awards under our Annual Incentive Program and applying a greater weight to relative ROE performance versus peer companies as a factor under our Annual Incentive Program beginning in 2016 and Performance ShareShares Program beginning in 2017. | |
| • | | ExcludingLimiting the contribution to earnings from specified classes ofnon-coupon investments outside of a range of -10% to +10% ofand prepayment fee and call premium income when calculating the earnings on these investments that are includedperformance measures in the Company’s EPS guidance range.our Annual Incentive Plan and Performance Shares Program. | |
As informed by our ongoing dialogue with our shareholders, and to more closely align with our value proposition to shareholders, this year, the Committee revised our Annual Incentive Program and Long-Term Incentive Program to further balance the financial metrics utilized by those programs between the Company’s absolute performance and its relative performance versus peer companies. Specifically, the Committee modified the Annual Incentive Program to eliminate the relative performance modifier and base the primary driver in determining the amount of the annual incentive awards for our NEOs, the initial annual performance factor, on three equally weighted performance metrics, including one relative metric:
EPS, on an AOI basis, compared to our EPS target range;
EPS growth, on an AOI basis, from the prior year period; and
Relative ROE as compared to the North American Life Insurance subset of our peer group.
The Committee also revised the Annual Incentive Program to reduce the volatility of outcomes under the plan, by modifying the performance scales and by limiting the contribution of earnings that may come from specified classes of non-coupon investments (e.g., private equity, hedge funds, real estate funds, equity securities, and other real estate investments). Based on our discussions with shareholders and feedback from our engagement efforts, the short-term fluctuations in earnings on these non-coupon investments were generally not viewed by our shareholders as being reflective of true operating performance. The performance of these non-coupon investments is fully reflected under the Book Value Performance Program, a key component of ourLong-Term Incentive Program.
The use of a weighted relative ROE metric, in lieu of a relative performance modifier, provides simplicity and transparency of results under the Annual Incentive Program and more effectively balances absolute and relative performance (e.g.,the weighting of the previous relative performance modifier was limited to 10%).
| | | | | | | | 40 | | | | | Notice of Annual Meeting of Shareholders and 20172019 Proxy Statement | |
| | | | | Compensation Discussion and Analysis: Executive Summary |
Similarly, the Committee eliminated the relative performance modifier from the Performance Shares Program under our Long-Term Incentive Program for awards granted in 2017. Instead, the program now uses a relative ROE measure over a three-year performance period compared to the median ROE performance of the North American Life Insurance subset of our peer group, along with absolute performance versus our long-term ROE target.
Total Direct Compensation Summary 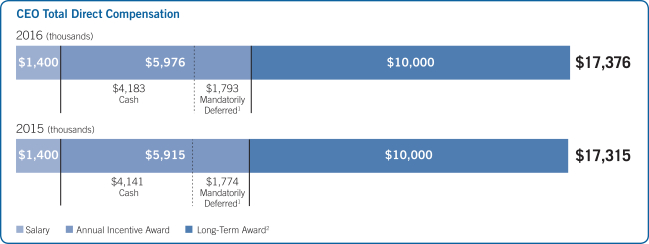
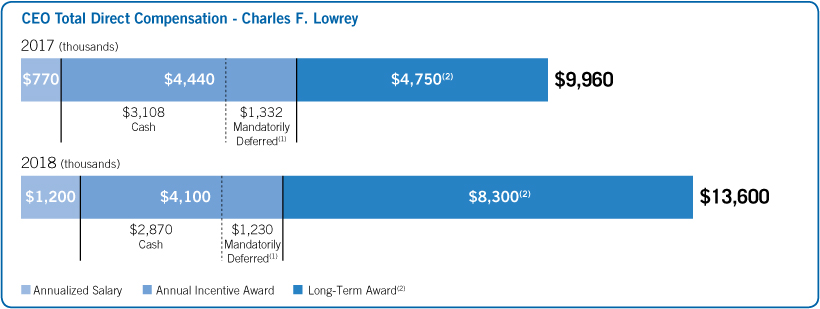
| (1) | 30% of the Annual Incentive Awards were mandatorily deferred into the Book Value Performance Program. |
| (2) | Represents long-term awards granted in 2018 and 2019 for 2017 and 2016 for 2016 and 20152018 performance, respectively. |
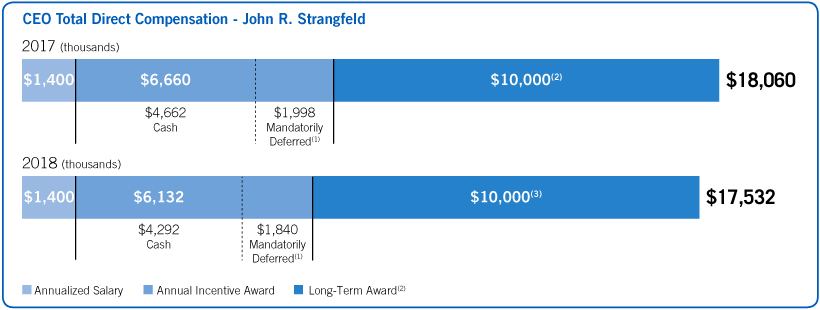
| | | Consistent with our compensation philosophy, approximately 92% of our CEO’s total direct compensation for 2016 was performance-based.
| (1) | 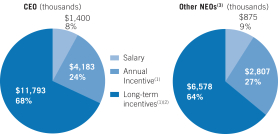
|
| (2) | Represents long-term awards granted in February 2018 for 2017 performance. |
| (3) | Represents long-term awards granted in November 2018 for 2018 performance. |
| (4) | Performance-based compensation |
| (5) | (1) | Performance-based compensation |
| (2) | Includes mandatory deferral of 30% of annual incentive |
| (6) | (3) | Based on average amounts |
| | | | | | | | Notice of Annual Meeting of Shareholders and 2019 Proxy Statement | | | | | 41 |
| | | | | 38 | | | Notice of Annual Meeting of Shareholders and 2017 Proxy Statement |
| | | | | Compensation Discussion and Analysis: Executive Summary |
| | | | | | | | | | | | | | WHAT WE DO | | | | | | | WHAT WE DON’T DO | 
| | Establish target and maximum awards inunder our Annual Incentive Program. | | | | | 
| | | CEO participation in our severance plan. | | | | | |
| | Establish target awards in our Long-Term Incentive Program. | | | | |
| | | Executive officer severance payments and benefits exceeding 2.99 times salary and cash bonus without shareholder approval. |
| | Apply a formulaic framework based on the Company’s financial
results relative topre-established targets for each incentive
program. | | | | | | | | | | | | | | | | | | |
| | Exercise limited or no discretion to increase formulaic incentive compensation awards. | | | | |
| | | Excise tax“gross-ups” upon change in control. | | | | | |
| | Use balanced performance metricsfor annual incentive and performance share/unit awards that factorconsider both the Company’s absolute performance and its relative performance versus peerspeers. | | | | |
| | | Discounting, reloading orre-pricing of stock options without shareholder approval. | | | | | |
| | Rigorous goal setting aligned to our externally disclosed annual and multi-yearmultiyear financial targets. | | | | |
| | | “Single-trigger” accelerated vesting of equity-based awards upon change in control. | | | | | |
| | 90%
86% or more of our NEOs’ target total direct compensation is performance based. | | | | |
| | | Multi-yearMultiyear guaranteed incentive awards for senior executives.
| | | | | |
| | Defer 30% of our NEOs’ and 10% of other senior executives’ annual incentive awardsinto the Book Value Performance Program. | | | | |
| | | Employment agreements with executive officers.NEOs. | | | | | |
| | Impose stock ownership requirements, and retention of 50% of equity basedequity-based awards. | | | | |
| | | Employee hedging or pledging of Company securities. | | | | | |
| | Maintain an enhanced clawback policy covering all executive officer incentive-based awards for material financial restatements and misconduct. | | | | | | | | | | | | | |
| | Limit perquisitesto items that serve a reasonable business purpose. | | | | | | | | | | | | | |
| | Closely monitor risks associated with our executive compensation programprograms and individual compensation decisions to ensureconfirm that they do not encourage excessive risk taking.risk-taking. | | | | | | | | |
| | | | |
| | Tie long-term diversity improvement to our performance share and unit awards. | | | | | | | | |
Consideration of Most Recent “Say on Pay” Vote | | | Following our 20162018 Annual Meeting of Shareholders, the Committee reviewed the results of the shareholder advisory vote on executiveNEO compensation (the “Say on Pay” Vote) that was held at the meeting with respect to the 20152017 compensation actions and decisions for Mr. Strangfeld and the other NEOs. Approximately 95%96% of the votes cast on the proposal were voted in support of the compensation of our NEOs. After careful consideration, and given the extensive changes we have made in the recent past, the Committee did not make any changes to our executive compensation program and policies as a result of the most recent Say on Pay vote. | | 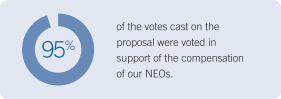  |
95% of the votes cast on the proposal were voted in support of the compensation of our NEOs.
| | | | | | | Notice of Annual Meeting of Shareholders and 2017 Proxy Statement | | | | 39 | |
| | | | | Compensation Discussion and Analysis: Executive Summary
|
Based on the results of the “Say on Pay” vote, as well as our ongoing dialogue with our shareholders, the Committee and our Board concluded that, even though our overall executive compensation policies and practices enjoy favorable shareholder support, it was appropriate to make certain changes to our Annual Incentive Program and Long-Term Incentive Program to further balance the metrics utilized in those programs between the Company’s absolute performance and its performance relative to our peer companies. The Committee modified the Annual Incentive Program so that the primary driver in determining the amount of the annual incentive awards for our NEOs, the initial annual performance factor, is based on three equally weighted performance metrics:
EPS, on an AOI basis, assessed relative to our EPS target range;
EPS growth, on an AOI basis, from the prior year period; and
Relative ROE as compared to the North American Life Insurance subset of our peer group.
The Committee also made other changes to the design of the Annual Incentive and Long-Term Incentive Programs, including:
reducing the volatility of outcomes under the Annual Incentive Program and providing symmetry of outcomes with respect to EPS results above and below our publicly disclosed EPS target range;
excluding earnings from specified classes of non-coupon investments outside of a range of -10% to +10% of the earnings on these investments that are included in the Company’s EPS guidance range; and
strengthening the relative performance metric under our Performance Shares Program, by replacing the use of a relative performance modifier, which modified results by+/-10%, with the use of Relative ROE, weighted at 50%, which compares Prudential’s ROE performance to that of the North American Life Insurance subset of our peer group.
Opportunity for Shareholder Feedback The Committee carefully considers feedback from our shareholders regarding our executive compensation program. Shareholders are invited to express their views to the Committee as described under “Communication with Directors” in this Proxy Statement. In addition, the advisory vote on the compensation of the NEOs provides shareholders with an opportunity to communicate their views on our executive compensation program. You should read this CD&A in conjunction with the advisory vote that we are conducting on the compensation of the NEOs (see “Item 3—Advisory Vote to Approve Named Executive Officer Compensation”). This CD&A, as well as the accompanying compensation tables, contains information that is relevant to your voting decision. | | | | | 40 | | | 42 | | | | | Notice of Annual Meeting of Shareholders and 20172019 Proxy Statement |
| | |
| | Compensation Discussion and Analysis | |
Philosophy and Objectives of Our Executive Compensation Program The philosophy underlying our executive compensation program is to provide an attractive, flexible, and market-based total compensation program tied to performance and aligned with the interests of our shareholders. Our objective is to recruit and retain the caliber of executive officers and other key employees necessary to deliver sustained high performance to our shareholders, customers, and communities where we have a strong presence. Our executive compensation program is an important component of these overall human resources policies. Equally important, we view compensation practices as a means for communicating our goals and standards of conduct and performance and for motivating and rewarding employees in relation to their achievements. Overall, the same principles that govern the compensation of all our salaried employees apply to the compensation of our executive officers. Within this framework, we observe the following principles: Retain and hiretop-caliber executives:Executive officers should have base salaries and employee benefits that are market competitive and that permit us to hire and retain world-class talent in our critical roles and high-caliber individuals at all levels; Pay for performance:A significant portion of the annual compensation of our executive officers should vary with annual business performance and each individual’s contribution to that performance; Reward long-term growth and profitability:Executive officers should be rewarded for achieving long-term results; Tie compensation to business performance:A significant portion of our executive officers’ compensation should be tied to measures of performance of our businesses;
Align compensation with shareholder interests:The interests of our executive officers should be linked with those of our shareholders through the risks and rewards of the ownership of our Common Stock; and Reinforce succession planning process:The overall compensation program for our executive officers should reinforce our robust succession planning process. 20162018 Incentive Programs
To ensurecreate a strong link between our incentive compensation opportunities and our short-term and longer termlonger-term objectives, we use two specific programs: our Annual Incentive Program and our Long-Term Incentive Program. Annual Incentive Program. The Annual Incentive Program is designed to reward strong financial and operational performance that furthers our short-term strategic objectives. Financial performance is primarily determined based on three equally-weighted performance metrics: (i) EPS achievement relative to our externally disclosed EPS targets; (ii) year-over-year growth in EPS; and (iii) relative ROE as compared to a group of peer group.companies. Long-Term Incentive Program. Our Long-Term Incentive Program consists of three parts that incent long-term value creation: performance shares and units that reward the achievement of our long-term ROE goals and increases in the market value of our Common Stock;Stock (as well as, for awards granted in 2018, increases in our senior management diversity); book value units that reward increases in book value per share; and stock options that reward increases in the market value of our Common Stock. ANNUAL COMPENSATION-RELATED RISK EVALUATION We monitor the risks associated with our executive compensation program,programs, as well as the components of our programprograms and individual executive compensation decisions, on an ongoing basis. Our compensation risk assessment occurs in two parts: a review of the Company’s compensation programs and a review of compensation decisions and payments, with a focus on our senior executives. In January 2017,2019, our Chief Risk Officer presented to the Committee was presented with the resultsa review of a study reviewing ourPrudential’s compensation programs, including ourthe executive compensation program, to assess the risks arising from our compensation policies and practices. The Committee agreed with the study’sreview’s findings that these risks were within our ability to effectively monitor and manage and that these compensation programs do not encourage unnecessary or excessive risk-taking and do not create risks that are reasonably likely to have a material adverse effect on the Company. Also, in June 2018, our Chief Risk Officer presented a study of the payouts under the compensation programs. The Committee agreed with the study’s findings that our compensation practices, including payouts, adhere to best market practices and do not encourage undue or excessive risk-taking. | | | | | | | | Notice of Annual Meeting of Shareholders and 20172019 Proxy Statement | | | | 41| | | 43 |
| | |
| | Compensation Discussion and Analysis | |
The figure below illustrates the portions of our NEOs 2018 target total direct compensation that are driven by the various performance metrics under our incentive programs*. Our programs are designed to align the interests of our executives with the interests of our shareholders and to link the drivers of short-term and long-term value creation with our executive compensation. 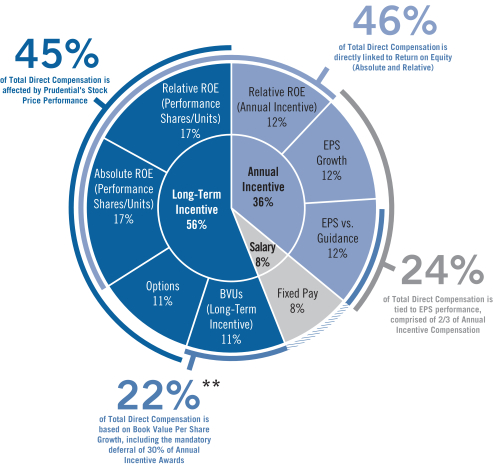
*The image above is a graphical representation of the components and drivers of total direct compensation. The illustration represents the average target total direct compensation values for our NEOs. **Represents Book Value Performance Program (11%) and 30% mandatory deferral of Annual Incentive Awards (equates to 10.8% of target total direct compensation). Our Annual Incentive Program and Long-Term Incentive Program share one common performance measure: our relative ROE, that is, our ROE as compared to the ROE of the North American Life Insurance subset of our peer group. The Committee believes that our relative ROE is a core value proposition for our shareholders and, accordingly, that relative ROE performance over both the short term and long term merits inclusion as a performance measure in each of our incentive programs. | | | | | | | | 44 | | | | | Notice of Annual Meeting of Shareholders and 2019 Proxy Statement |
| | |
| | Compensation Discussion and Analysis | |
How We Make Compensation Decisions Role of the Compensation Committee The Committee is responsible to our Board for overseeing the development and administration of our compensation and benefits policies and programs. The Committee, which consists of three independent directors, is responsible for the review and approval of all aspects of our executive compensation program. Among its duties, the Committee is responsible for formulating the compensation recommendations for our CEO and approving all compensation recommendations for our officers at the senior vice president level and above, including: annual review and approval of incentive program design, goals and objectives for alignment with our compensation and business strategies; evaluation of individual performance results in light of these goals and objectives; evaluation of the competitiveness of each executive officer’s total compensation package; and approval of any changes to the total compensation package, including, but not limited to, base salary, annual and long-term incentive award opportunities, payouts, and retention programs. Following review and discussion, the Committee submits its recommendations for compensation for these executive officers to the independent members of our Board for approval. The Committee is supported in its work by the head of theour Chief Human Resources Department, herOfficer, his staff, and the Committee’s executive Compensation Consultant, as described below. The Committee’s charter, which sets out its duties and responsibilities and addresses other matters, can be found on our website at www.prudential.com/governance. Role of the Chief Executive Officer Within the framework of the compensation programs approved by the Committee and based on management’s review of market competitive positions, each year our CEO recommends the level of base salary increase (if any), the annual incentive award, and the long-term incentive award value for our officers at the senior vice president level and above, including the other NEOs. These recommendations are based upon hisan assessment of each executive officer’s performance, the performance of the individual’s respective business or function, and retention considerations. The Committee reviews our CEO’s recommendations and approves any compensation changes affecting our executive officers as it determines in its sole discretion. Given our recent leadership transition, our former CEO and our current CEO made joint recommendations for compensation paid in respect of 2018. Our CEO does not play any role with respect to any matter affecting his own compensation and is not present when the Committee discusses and formulates his compensation recommendation. | | | | | | | | Notice of Annual Meeting of Shareholders and 2019 Proxy Statement | | | | | 45 |
| | |
| | Compensation Discussion and Analysis | |
Role of the Compensation Consultant The Committee has retained Frederic W. Cook & Co., Inc. as its executive Compensation Consultant. The Compensation Consultant reports directly to the Committee, and the Committee may replace the Compensation Consultant or hire additional consultants at any time. A representative of the Compensation Consultant attends meetings of the Committee, as requested, and communicates with the Committee Chair between meetings. The Compensation Consultant provides various executive compensation services to the Committee pursuant to a written consulting agreement with the Committee. Generally, these services include advising the Committee on the principal aspects of our executive compensation program and evolving industry practices and providing market information and analysis regarding the competitiveness of our program design and our award values in relationship to their performance. During 2016,2018, the Compensation Consultant performed the following specific services: Provided a presentation on executive compensation trends and external developments. Provided an annual competitive evaluation of total compensation for the NEOs, as well as overall compensation program share usage, dilution, and fair value expense. Provided recommendations on CEO total direct compensation to the Committee at its February meeting, without prior review by our CEO. Reviewed with our CEO hiscurrent and former CEOs their compensation recommendations with respect to the other NEOs.officers. | | | | | 42 | | | Notice of Annual Meeting of Shareholders and 2017 Proxy Statement |
| | | | | Compensation Discussion and Analysis
|
Reviewed Committee agendas and supporting materials in advance of each meeting, and raised questions/issues with management and the Committee Chair, as appropriate. Provided advice on changes to the performance metrics under the Annual Incentive Program and the Long-Term Incentive Program.
Reviewed drafts and commented on the CD&A and related compensation tables for the Proxy Statement. Reviewed the compensation peer group used for competitive analyses. Attended Committee meetings when requested by the Committee Chair. Assisted with compensation actions related to the leadership succession plan. The Compensation Consultant provided no services to management during 2016.2018. The Committee retains sole authority to hire the Compensation Consultant, approve its compensation, determine the nature and scope of its services, evaluate its performance, and terminate its engagement. The total amount of fees paid to the Compensation Consultant for services to the Committee in 20162018 was $175,723.$214,961. The Compensation Consultant received no other fees or compensation from us, except for $3,400 to participate in a general industry survey of long-term compensation. The Compensation Committee has assessed the independence of the Compensation Consultant pursuant to the listing standards of The New York Stock Exchangethe NYSE and SEC rules and concluded that no conflict of interest exists that would prevent the Compensation Consultant from serving as an independent consultant to the Compensation Committee. | | | | | | | | 46 | | | | | Notice of Annual Meeting of Shareholders and 2019 Proxy Statement |
| | |
| | Compensation Discussion and Analysis | |
Compensation Peer Group The Committee uses compensation data compiled from a group of peer companies in the insurance, asset management, and other diversified financial services industries generally selected from the Standard & Poor’s 500 Financials Index (the “Peer Group”). The Committee periodically reviews and updates the Peer Group, as necessary, upon recommendation of the Compensation Consultant. We believe the Peer Group represents the industries with which we currently compete for executive talent, and also includes our principal business competitors. | | | | | | | | | | | | Although included within the broad financial services sector, we exclude from the Peer Group companies such as property and casualty insurers and investment banking firms that predominantly offer different products, have substantially different business models and with whom we have less direct competition for executive talent. For 2016,2018, the Peer Group consisted of the following 20 companies: | | | | | | | | | North American Life Insurance Companies | | Consumer Finance Companies | | Asset Management and
Custody Banks | | Diversified Banks | | | | | | | | | • AFLAC, IncorporatedInc. • Lincoln National • Manulife Financial Corporation • MetLife, Inc. • Principal Financial Group • Sun Life Financial Inc. | | • American Express
Company • Capital One Financial Corporation | | • Ameriprise Financial, Inc. • The Bank of New York
Mellon Corporation • BlackRock, Inc. • Franklin Resources, Inc. • Northern Trust
Corporation • State Street Corporation | | • Bank of America Corporation • Citigroup Inc. • JPMorgan Chase & Co. • PNC Financial Services Group, Inc. • U.S. Bancorp • Wells Fargo & Company | | | | | | | | | | | | |
Use of Competitive Data We compete in several different businesses, most of which are involved in helping individuals and institutions grow and protect their assets. These businesses draw their key employees from different segments of the marketplace. Our executive compensation program is designed with the flexibility to be competitive and motivational within the various marketplaces in which we compete for executive talent, while being subject to centralized design, approval, and control. The Committee relies on various sources of compensation information to ascertain the competitive market for our executive officers, including the NEOs. | | | | | | | Notice of Annual Meeting of Shareholders and 2017 Proxy Statement | | | | 43 | |
| | | | | Compensation Discussion and Analysis
|
To assess the competitiveness of our executive compensation program, we analyze Peer Group compensation data obtained from peer company proxy materials as well as compensation and benefits survey data provided by national compensation consulting firms, such as Willis Towers Watson, McLagan Partners, and Mercer. As part of this process, we measure actual pay levels within each compensation component and in the aggregate. We also review the mix of our compensation components with respect to fixed versus variable, short term versus long term, and cash versus equity-based pay. This information is then presented to the Committee for its review and use. The Committee generally compares the compensation of each NEO in relation to botheach of the 25th, the 50th and the 75th percentiles of the Peer Group for similar positions, as we are significantly above the median of the Peer Group in terms of size.positions. In addition, the Committee takes into account various factors such as our performance within the Peer Group, the unique characteristics of the individual’s position, and any succession and retention considerations. In general, compensation levels for an executive officer who is new to a position tend to be at the lower end of the competitive range, while seasoned executive officers with strong performance who are viewed as critical to retain would be positioned at the higher end of the competitive range. For example, due to their promotions in December 2018, Messrs. Lowrey’s and Tanji’s target total direct compensation is at or below the Peer Group median for their respective positions. Generally, differences in the levels of total direct compensation among the NEOs are primarily driven by the scope of their responsibilities, differences in the competitive market datapay range for similar positions, and considerations of internal equity. | | | | | | | | Notice of Annual Meeting of Shareholders and 2019 Proxy Statement | | | | | 47 |
| | |
| | Compensation Discussion and Analysis | |
Components of Our Executive Compensation Program TheIn the following tables, for the principal components of our executive compensation program, we present their purpose, key characteristic and type of performance measured (if applicable) are presented in the following table.. We measure the program’s competitiveness both by comparing relevant market data with the target and actual amounts paid at each executive officer position as well as by salary grades, which are composed of many positions that we consider to have similar responsibilities.
Total Direct Compensation | | | | | | | | | | | Compensation Component | | Purpose | | Key Characteristic | | Performance Measured | Base Salary | | • Compensate executive officers fairly for the responsibility of the position held | | Fixed | | Individual | Annual Incentive Awards | | • Motivate and reward executive officers for achieving our short-term business objectives • Provide balance by rewarding performance relative to our peer groupPeer Group | | Variable | | Corporate and Individual | Long-Term Incentive Awards | | • Motivate executive officers by linking incentives to the achievement of our multi-yearmultiyear financial and other goals, our relative performance, and the performance of our Common Stock and book value over the long term • Reinforce the link between the interests of our executive officers and shareholders | | Variable | | Corporate |
Other Forms of Compensation | | | | | Compensation Component | | Purpose | | Key Characteristic | | | Health & Welfare, and Retirement Plans | | • Provide benefits that promote employee health and support employees in attaining financial security | | Fixed | | | Perquisites and Other Personal Benefits | | • Provide a business-related benefit to our Company, and to assist in attracting and retaining executives | | Fixed | Post-Employment Compensation | | | Post-Employment Compensation | | • Provide temporary income following an executive’s involuntary termination of employment, and in the case of a change of control, to also provide continuity of management | | Fixed | | |
In keeping with our commitment to diversity and inclusion in practice, the performance shares and units awarded to executives at the senior vice president level and above (and equivalents) in February 2018 were made subject to a performance objective intended to improve the representation of diverse persons among our senior management over the 2018 through 2020 performance period: If we meet our goal of increased representation of diverse persons by five percentage points or more over this period, payouts will be increased by up to 10%. If there is no change in representation, payouts will be decreased by 5%. If such representation decreases over this period, payouts will be decreased by up to 10%. | | | | | | | | 44 48 | | | | | Notice of Annual Meeting of Shareholders and 20172019 Proxy Statement |
| | |
| | Compensation Discussion and Analysis | |
The following discussion contains information regarding certain performance measures and goals. These measures and goals are disclosed in the limited context of our executive compensation program. Shareholders should not apply these performance measures and goals to other contexts. FORMULAIC FRAMEWORK FOR INCENTIVE PROGRAMS Awards under each of our incentive programs are funded at the level determined by our financial results relative topre-established targets and performance relative to peer companies under formulas for each incentive program. The Board believes it generally should exercise limited or no discretion to increase our NEOs’ formula-based awards. For the annual incentive program, the formula uses three equally-weightedequally weighted performance metrics:metrics, in each case based on after-tax adjusted operating income: (i) EPS results relative to our externally disclosed EPS targets; (ii) year-over-year growth in EPS; and (iii) relative ROE as compared to the North American Life Insurance subset of our peer group.Peer Group. Similarly, under our performance shares program, beginning with awards made in 2017, payments will beare determined based on our average ROE results over the three-year performance period, as compared to both a performance scale set at the start of the period and the ROE results of the North American Life Insurance subset of our peer groupPeer Group over that period.period, giving equal weight to each. The Book Value Performance Program tracks our adjusted book value per share. Adjusted book value per share which excludes the impact on attributed equity of accumulated other comprehensive income and of foreign currency exchange rate remeasurement included in net income or loss, as described in Appendix A to this Proxy Statement. To more accurately reflect the operating performance of our business, the Committee has approved apre-determined framework of adjustments to our reported financial results for incentive program purposes. Generally, these adjustments are made to excludeone-time or unusual items and external factors that are inconsistent with the assumptions reflected in our financial plans. The standard adjustments to reported EPSfinancial results under our formulaic framework may vary from year to year and may have either a favorable or unfavorable impact on the funding of the Annual Incentive Award Pool.Pool and may affect other performance measures, such as the calculation of adjusted book value per share under our Book Value Performance Program. Standard adjustments to reported financial results are made: to exclude the impact of market unlockings in our individual annuities businessIndividual Annuities, Individual Life and International Insurance businesses (including, for 2016,2018, adjustments to reflect updated estimates of profitability based on market performance in relation to our assumptions); to exclude the impact of changes in our assumptions for investment returns, actuarial experience, and customer behavioral expectations (mortality, morbidity, lapse, and similar factors and reserve refinements); to exclude integration costs associated withor make other adjustments related to merger and acquisition activity (none(for 2018, we added back the earnings that were included in 2016)our 2018 EPS guidance attributable to our businesses in Italy and Poland, which were classified as divested and run-off businesses in 2018 following the signing of definitive agreements to sell those businesses); for accounting-related changes not included in our annual operating plan (for 2018, we excluded the impacts on our earnings stemming from the Tax Cuts and Jobs Act due to the change in our effective tax rate and the impact of related management actions); | • | | for accounting changes not included in our annual operating plan (none in 2016); | |
to exclude earnings from specified classes ofnon-coupon investments and prepayment fee and call premium income from fixed maturity investments outside of a range of-10% to +10% of these earnings, combined, that are included in our EPS guidance range (this resulted in an adjustment for 2018, as these earnings fell below our EPS guidance expectations by more than 10%); and for other items not considered representative of the results of operations for the period or not included in guidance, as approved by the Committee (there were none in 2018). | • | | to exclude earnings from specified classes of non-coupon investments outside of a range of -10% to +10% of the earnings on these investments that are included in the Company’s EPS guidance range (for 2016, this did not result in an adjustment); and | |
| • | | for other items not considered representative of the results of operations for the period or not included in guidance, as approved by the Committee (for 2016, we excluded the benefit from a lower income tax rate in Japan, adopted subsequent to the issuance of 2016 guidance; we also excluded certain costs related to Company-wide initiative spending and theone-time cost of the early extinguishment of debt in 2016). | |
| | | | | | | | Notice of Annual Meeting of Shareholders and 2019 Proxy Statement | | | | | 49 |
| | |
| | Compensation Discussion and Analysis | |
Direct Compensation Components Annually, the Compensation Committee reviews the competitive analysis of total direct compensation for the NEOs. Based on this evaluation, the Committee may selectively adjust the base salary, annual incentive award target, and long-term target amounts of the NEOs. In determining any adjustments, the Committee takes into account the following factors: level of experience and impact in the role; changes in market data; and compensation positioning overall and by component. Executives new to their current roles are positioned towards the lower end of their competitive range while executives with more experience are generally positioned at the higher end of the range. BASE SALARY Base salary is the principal fixed component of the total direct compensation of our executive officers, including the NEOs, and is determined by considering the relative importance of the position, the competitive marketplace, and the individual’s performance and contributions. Base salaries are reviewed annually and, typically, are increased infrequently and then mostly at the time of a change in position or assumption of new responsibilities. SALARY DECISIONS NoneIn connection with the succession planning changes in 2018, the Committee made the following salary decisions effective as of the NEOs received an increaseDecember 1, 2018: Mr. Lowrey’s salary was increased to base$1,200,000; Mr. Tanji’s salary for the 2016 performance year.was increased to $600,000; Mr. Falzon’s salary was increased to $1,000,000; and Mr. Sleyster’s salary was increased to $700,000.
| | | | | | | Notice of Annual Meeting of Shareholders and 2017 Proxy Statement | | | | 45 | |
| | | | | Compensation Discussion and Analysis
|
Annual Incentive Awards At least once a year, the Committee reviews the Annual Incentive Program and makes changes as needed. The Committee approved the 20162018 Annual Incentive Program for our most senior executives, including the NEOs, on the following terms and conditions. TARGET AWARD OPPORTUNITIES The Compensation Committee established target and maximum annual incentive award opportunities for each NEO in 2012. No adjustments had been made to these award opportunitiesof the NEOs for NEOs who have held the same role since 2012, namely our Chief Executive Officer and Vice Chairman. Consequently, the positioning of target total direct compensation (i.e., base salary, target annual incentive and target long-term incentive) relative to counterparts at companies in the compensation peer group had decreased since last calibrated in 2012. To address this decrease, the Committee increased Mr. Strangfeld’s annual incentive target from $5.6 million to $6 million and Mr. Grier’s target from $4.8 million to $5.1 million in 2016. Considering their compensation positioning and greater level of experience and impact, the Committee also adjusted Mr. Falzon’s annual incentive target from $2.45 million to $3 million and Mr. Pelletier’s target from $3 million to $4 million in 2016.
The specific target and maximum annual incentive award opportunities for each NEO for 20162018 were as follows:
| | | Named Executive Officers | | Target Annual Incentive Award
Opportunity | | Maximum Annual Incentive Award Opportunity | | | Target Annual Incentive Award
Opportunity | | | Maximum Annual Incentive Award Opportunity | | Charles F. Lowrey | | | | $4,000,000 | | | | $ 8,000,000 | | | John R. Strangfeld | | $ | 6,000,000 | | | $ | 12,000,000 | | | | $6,000,000 | | | | $12,000,000 | | Kenneth Y. Tanji | | | | $ 852,150 | | | | $ 1,704,300 | | | Robert M. Falzon | | $ | 3,000,000 | | | $ | 6,000,000 | | | | $3,000,000 | | | | $ 6,000,000 | | | Mark B. Grier | | $ | 5,100,000 | | | $ | 10,200,000 | | | | $5,100,000 | | | | $10,200,000 | | | Charles F. Lowrey | | $ | 4,000,000 | | | $ | 8,000,000 | | | | Stephen Pelletier | | $ | 4,000,000 | | | $ | 8,000,000 | | | | $4,000,000 | | | | $ 8,000,000 | | Scott G. Sleyster | | | | $1,539,000 | | | | $ 3,078,000 | |
Each year, the Committee establishes an annual performance factorPerformance Factor that is the primary driver in determining the amount of the annual incentive awards for our NEOs. For 2016,2018, we used the following process to determine this Performance Factor: Step 1. EstablishedEstablish Initial Performance Factor.Factor
Consistent with the formulaic framework for our annual incentive award program,Annual Incentive Program, the Committee established an Initial Performance Factor based on the following three financial metrics, giving equal weight to each (i.e., each metric is weightedone-third): EPS for 2016,2018, on an AOI basis, assessed relative to our EPS target range (the “EPS Target Factor”); Growth in EPS, on an AOI basis, for 20162018 as compared to 20152017 (the “EPS Growth Factor”); and ROE for 20162018 as compared to the median ROE for 20162018 achieved by the North American Life Insurance subset of the Peer Group (the “Relative ROE Factor”). The Initial Performance Factor was applied to the target annual incentive award opportunity for each NEO to determine theirthat NEO’s annual incentive funding. For purposes of the 20162018 Annual Incentive Program, EPS and ROE were calculated as follows: EPS is Earnings Per Share of Common Stock (diluted), based onafter-tax adjusted operating income (“AOI”). ROE is determined usingafter-tax AOI divided by adjusted book value, and for our peer companies is determined based on the comparable financial metric from each peer company’s quarterly financial reports, in each case, based on a rolling quarterly average for the four quarters ended September 30, 2016.2018. For more information regarding our 20162018 annual measures of EPS, AOI and ROE, andas well as adjusted book value, see Appendix A to this Proxy Statement. | | | | | | | | 50 | | | | | Notice of Annual Meeting of Shareholders and 2019 Proxy Statement |
| | |
| | Compensation Discussion and Analysis | |
We applied ourpre-set preset formulaic framework to our January 20172019 estimate of our 20162018 reported AOI, EPS, and ROE. Standard Adjustments We make standard adjustments to estimated AOI, EPS, and ROE under our formulaic framework that may vary from year to year and may have either a favorable or unfavorable impact on the funding of the Annual Incentive Award Pool. For 2016,2018, these standard adjustments resulted in the following changes to EPS: | | EPS (January Estimate) | | $ | 9.16 | | | $ | 11.68 | | | Market Unlockings | | | -0.14 | | | | + 0.11 | | | Actuarial Assumptions | | | +0.64 | | | | + 0.31 | | | Other Items | | | +0.07 | | | M&A Adjustments | | | | + 0.03 | | Adjustments for the Tax Cuts and Jobs Act | | | | - 0.66 | | Non-Coupon Investments/Prepayment Fee and Call Premium Income | | | | + 0.15 | | | EPS (Annual Incentive Program) | | $ | 9.73 | | | $ | 11.62 | |
The market unlockings adjusted our reported results for our Individual Annuities, businessIndividual Life and International Insurance businesses to exclude the impact of actual equity market performance relative to our plan assumption. The adjustment for 20162018 market unlockings reducedincreased EPS under the annual incentive programAnnual Incentive Program by approximately $0.14.$0.11. Annually, based on Company-specific data, industry data, and the current long-term economic outlook, we update our actuarial assumptions on long-term market returns (equity and fixed income) and customer behavioral expectations (e.g., mortality, morbidity, and lapses). These updates and related refinements result in a cumulative revaluation of our reserves and the carrying values of our deferred acquisition costs. While GAAP requires these updates to be reported in the current period, they are not representative of annual performance since they relate to outcomes in both prior and future years. For these reasons, they are excluded from EPS under the annual incentive programAnnual Incentive Program (regardless of whether they are positive or negative). In 2016,2018, the adjustments to account for these updates had a positiveincreased EPS impact ofunder the Annual Incentive Program by approximately $0.64. | | | | | 46 | | | Notice of Annual Meeting of Shareholders and 2017 Proxy Statement |
| | | | | Compensation Discussion and Analysis
|
$0.31.Other items not considered representative of operating results or included in our 2016Our EPS guidance range are alsofor 2018 included a full year of earnings attributable to our Pramerica of Italy and Pramerica of Poland operations. However, we classified those businesses as divested and run-off businesses in 2018 upon the signing of definitive agreements to sell them, and earnings from those operations were excluded from EPS under the program. In 2016, these excluded items included certain costs related to Company-wide initiative spending and the benefit fromat that time. As a lower income tax rate in Japan adopted subsequent to the issuance of 2016 guidance. These adjustments contributed approximately $0.07 in 2016result, we increased EPS under the program.Annual Incentive Program by approximately $0.03 to add back earnings from those operations.
TheseAs the adoption of the Tax Cuts and Jobs Act was uncertain at the time we issued our EPS guidance for 2018, we did not assume any impacts from the Tax Act in our guidance range. As a result, we have excluded the impact of the Tax Act on earnings when calculating EPS under the Annual Incentive
Program. This adjustment resulted in a decrease to EPS under the Annual Incentive Program of approximately $0.66. Finally, we limit earnings volatility from specified classes ofnon-coupon investments and prepayment fee and call premium income by excluding these earnings that are outside of a range of-10% to +10% from that assumed in our EPS guidance range. For 2018, this adjustment increased EPS under the Annual Incentive Program by approximately $0.15 as these earnings fell below our EPS guidance expectations by more than 10%. In the aggregate, these standard adjustments under our pre-setpreset formulaic framework had a net positivenegative effect of $0.57$0.06 to EPS under the annual incentive program.Annual Incentive Program. Step 1: Establish EPS Target Factor The following table depicts the EPS scale target range for 2016.2018. This target range is aligned to our publicly disclosed EPS guidance range. Our adjusted EPS for 20162018 of $9.73$11.62 per share of Common Stock correspondedcorresponds to an EPS Target Factor of 0.947.1.034. | | | | | | | | | | | | 2016 EPS(1) | | | EPS Target Factor(2) | | | | | | $7.00 or below | | | | 0.50 | | | | | $9.75 | | | | 0.95 | | | Target Range | | | $10.00 | | | | 1.00 | | | | | | $10.25 | | | | 1.05 | | | | | | $13.00 or above | | | | 1.50 | |
| | | | | | | | | | | | | | | 2018 EPS(1) | | | EPS Target Factor(2) | | | | | | $14.89 or above | | | | 1.50 | | | | | $11.70 | | | | 1.05 | | Target Range | | | $11.45 | | | | 1.00 | | | | | | $11.20 | | | | 0.95 | | | | | | $8.02 or below | | | | 0.50 | |
| (1) | Determined on an AOI basis, subject to certain adjustments. |
| (2) | The EPS Target Factor is interpolated on a straight-line basis between the EPS data points. |
Step 2: Establish EPS Growth Factor Our adjusted EPS for 20162018 was $9.73$11.62 per share of Common Stock, a decreasean increase of $0.08$0.54 per share from our adjusted EPS of $9.81(1)$11.08 for 2015.2017. This corresponds to an EPS Growth Factor of 0.992.1.049. (1) | EPS for 2015 was increased by $0.06 to exclude earnings from specified classes of non-coupon investments outside of a range of -10% to +10% of the earnings on these investments that are included in the Company’s EPS guidance range. |
Step 3: Establish Relative ROE Factor Our adjusted ROE for 20162018 was 12.5%13.5%, which is 0.60.2 percentage points higherlower than the median 20162018 ROE for the North American Life Insurance subset of the Peer Group. This corresponds to a Relative ROE Factor of 1.050.983 based on the scale depicted below. | | | | | | | | | | | | ROE +/- Peer Median(1) | | | | Relative ROE Factor(2) | | | | | | 3% | | | | 1.25 | | | | | | 2% | | | | 1.17 | | | | | | 1% | | | | 1.08 | | | | | | 0% | | | | 1.00 | | | | | | -1% | | | | 0.92 | | | | | | -2% | | | | 0.83 | | | | | | -3% | | | | 0.75 | | |
| | | | | | | | | | | | | | | | | ROE +/- Peer Median(1) | | | | Relative ROE Factor(2) | | | | | | 3% | | | | 1.25 | | | | | | 2% | | | | 1.17 | | | | | | 1% | | | | 1.08 | | | | | | 0% | | | | 1.00 | | | | | | -1% | | | | 0.92 | | | | | | -2% | | | | 0.83 | | | | | | -3% | | | | 0.75 | | |
| (1) | Determined on an AOI basis, subject to certain adjustments as discussed above. |
| (2) | The Relative ROE Factor is interpolated on a straight-line basis between the ROE +/- Peer Median data points. |
| | | | | | | | Notice of Annual Meeting of Shareholders and 2019 Proxy Statement | | | | | 51 |
| | |
| | Compensation Discussion and Analysis | |
Step 2. Determined4: Determine Final Performance Factor. Weighting each of the EPS Target Factor (0.947)(1.034), the EPS Growth Factor (0.992)(1.049), and the Relative ROE Factor (1.05)(0.983) byone-third, we arrived at an Initial Performance Factor of 0.996.1.022. Once the Initial Performance Factor is determined, the Board believes it generally should not exercise meaningful discretion to increase the Performance Factor for strategic or other considerations. For the last threefour years, the Committee didhas not makemade any discretionary adjustments based on these considerations. Based on the foregoing, the Final Performance Factor for 20162018 was determined to be 0.996.1.022. This factor was then applied to the target award opportunities ofopportunity for each NEO to determine theirthat NEO’s annual incentive awards,award, with minor adjustments primarily due to rounding. The following table summarizes the calculation of the Final Performance Factor. Summary of 20162018 Performance Factor Mechanics | | | | | | | Step 1: Establish EPS Target Factor | | | | 20162018 EPS (on AOI basis) | | $ | 9.1611.68 | | Standard adjustments | | $ | 0.57- 0.06 | | EPS under Annual Incentive Program | | $ | 9.7311.62 | | EPS of $9.73$11.62 translates to an EPS Target Factor of | | | 0.9471.034(1) | | | | Step 2: Establish EPS Growth Factor | | | | 20162018 EPS (on AOI basis) | | $ | 9.1611.68 | | Standard adjustments | | $ | 0.57- 0.06 | | EPS under Annual Incentive Program | | $ | 9.7311.62 | | 20152017 EPS under Annual Incentive Program | | $ | 9.81(2)11.08 | | EPS Growth under Annual Incentive Program | | ($ | 0.08)0.54 | | EPS Growth of ($0.08)$0.54 translates to an EPS Growth Factor of | | | 0.9921.049 | | | | Step 3 : Establish Relative ROE Factor | | | | 20162018 ROE Performance | | | 12.5%13.5% | | 20162018 Peer Median ROE Performance | | | 11.9%13.7% | | ROE performance as compared to median ROE performance for life insurer peers | | | 0.6%(1)-0.2% | | FavorableUnfavorable ROE of 0.6%-0.2% translates to a Relative ROE Factor of | | | 1.050.983(1) | | | | Step 4: Determine Final Performance Factor | | | | EPS Target Factor (1.034) times 1/3 | | | 0.3160.345 | | EPS Growth Factor (1.049) times 1/3 | | | 0.3300.349 | | Relative ROE Factor (0.983) times 1/3 | | | 0.3500.328 | | Initial Performance Factor | | | 0.9961.022 | | | | | | | Discretionary Adjustments made by Committee for 20162018 | | | None | | | | Final Performance Factor | | 0.9961.022
| |
| (1) | Based on interpolation on the scales above. |
(2) | EPS for 2015 was increased by $0.06 to exclude earnings from specified classes of non-coupon investments outside of a range of -10% to +10% of the earnings on these investments that are included in the Company’s EPS guidance range. |
| | | | | | | | 52 | | | | | Notice of Annual Meeting of Shareholders and 20172019 Proxy Statement | | | | 47 | |
| | |
| | Compensation Discussion and Analysis | |
Annual Incentive Award Decisions for 20162018 The principal driver of the actual annual incentive awards for the NEOs is the Final Performance Factor. The Committee also considers individual performance and contributions in determining final awards. At the beginning of 2016, our CEO met2018, Mr. Strangfeld discussed with the Committee, and each of the other NEOs to outline and discussNEO discussed with themhis manager, the key financial factors for determining awards under our annual incentive programAnnual Incentive Program and theirthe NEO’s expected contributions to that performance. | | | | | | | | | | | | | Mr. StrangfeldLowrey | | | | | | | | | | | | | | | | | | | | | | 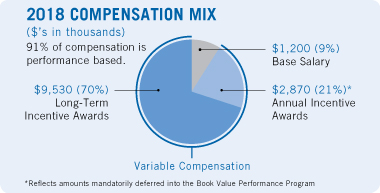 | | | | ANNUAL INCENTIVE AWARD DECISION Consistent with the Final Performance Factor, Mr. Lowrey’s incentive award was $4,100,000, or approximately 1.025 times his target award amount. This award compares to an annual incentive award of $4,440,000 for 2017, representing a decrease of 7.7%.
Of the $4,100,000, $1,230,000 was mandatorily deferred into the Book Value Performance Program. | | | | | | | | | | | | | | | |
| | KEY PERFORMANCE ACHIEVEMENTS In assessing the individual performance of Mr. Lowrey, the Committee identified and examined a broad range of corporate and individual performance factors, including: | | | | | | | | | | | | • His individual development that led to execution of the Company’s leadership succession, culminating in the appointment of Mr. Lowrey as Chief Executive Officer effective December 1, 2018; • His comprehensive succession planning for the International Businesses, including the successful transition of the leadership of the International Businesses to Mr. Sleyster, who replaced Mr. Lowrey as Executive Vice President and Chief Operating Officer, International Businesses, effective December 1, 2018; • Leading the International Insurance business that earnedpre-tax AOI of $3.3 billion for 2018, a 2% increase from 2017, excluding the impact of changes in currency exchange rates; • His contributions to the successful adaptation to current market conditions of major product lines serving death protection and retirement needs in our key international markets through multiple distribution channels, including a 16% increase in U.S. dollar product sales in Japan in 2018 compared to 2017;* • His leadership in growing our Life Planner count by 2% in 2018 compared to 2017, including achieving record levels in Japan and Brazil; * Sales are based on annualized new business premiums. | | | | • His leadership of our Latin America operations that experienced continued business momentum in 2018, including the expansion of distribution capabilities in our Brazil operations; • His role in the Company’s constructive engagement with international regulators on emerging issues, including his leadership in influencing the development of revised insurance capital standards; • Continuing to evolve the International Businesses’ strategy by focusing on key markets, including further advancing our business strategy in Africa and completing the sale of our Pramerica of Poland subsidiary; and • Enhancing collaboration across our International and U.S. Businesses, including expansion of our Financial Wellness platform. | | | | | | | | | | | | | | | | | | | | | | |
| | | | | | | | Notice of Annual Meeting of Shareholders and 2019 Proxy Statement | | | | | 53 |
| | |
| | Compensation Discussion and Analysis | |
| | | | | | | | | | | | | | | | 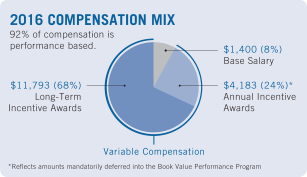 Mr. Strangfeld | | | | | | | | | | | | | | | | | | | | | | | | | | 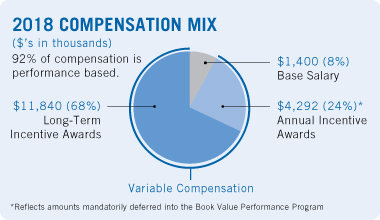 | | | | ANNUAL INCENTIVE AWARD DECISION Based on the Final Performance Factor and the Committee’s evaluation of his performance as CEO during 2018, in February 2017,2019, the Committee recommended, and the independent members of our Board approved, an annual incentive award of $5,976,000$6,132,000 for Mr. Strangfeld for 2016, or2018, representing approximately 0.9961.022 times his target award amount. This award compares to an annual incentive award of $5,915,000$6,660,000 for 2015,2017, representing an increasea decrease of 1.0%7.9%. Of the $5,976,000, $1,792,800$6,132,000, $1,839,600 was mandatorily deferred into the Book Value Performance Program. | | | | | | | | | | | | | | | | | | | | KEY PERFORMANCE ACHIEVEMENTS In assessing the individual performance of Mr. Strangfeld ouras CEO, the Committee and the independent members of our Board, considered the evaluation of his performance that was conducted by the Lead Independent Director of our Board and the Committee Chair. This evaluation identified and examined a broad range of corporate and individual performance factors, including: | | | | | | | | | | | | | | | | • Facilitating the Company’s leadership succession plans, including the appointment of Charles M. Lowrey as Chief Executive Officer and Robert M. Falzon as Vice Chairman; • After-tax AOI of $4.11$5.02 billion and EPS, based onafter-tax AOI, of $9.13$11.69 in 2016;2018, reflecting strong core performance from our businesses. EPS, based onafter-tax AOI, increased 10.5% versus 2017; • Operating return on average equity of 12.7% for 2018, at thehigh-end of our objective of 12% for 2016, with solid core performance from our businesses partly offset byto 13% over the impact of a number of inherently variable and episodic items including our annual actuarial review;near-to-intermediate term; • Growth in adjusted book value per share of our Common Stock to $78.95$96.06 at December 31, 20162018 versus $73.59$88.67 per share at December 31, 2015,2017, an increase of $5.36,$7.39, or 7%8.3%, after payment of four quarterly dividends totaling $2.80$3.60 per share; • International Division’s 8% increase in constant dollar sales(1) in 2016 versus 2015; • Retirement account values of $386 billion at December 31, 2016, up 5% from a year earlier;
• Asset Management’s assets under management of $1.04 trillion at December 31, 2016, up 8% from a year earlier;
• Individual Life’s 7% increase in sales in 2016 versus 2015;
• Group Insurancepre-tax adjusted operating income of $220 million for 2016, up 25% from 2015;
• Completed the acquisition of a 40% stake in AFP Habitat, a leading provider of retirement services in Chile;
| | | | • Took actions to restructure the Individual Annuities business to reduce capital volatility and improve earnings and cash flow prospects;
• Returned $3.2$3.0 billion of capital to shareholders, including $2.0 billion through our share repurchase program and $1.2 billionrepresenting an increase in the form of Common Stock dividends, compared to a total of $2.1 billion of shareholder distributions in 2015.of approximately 20% from 2017. The Company has one of the highest dividend yields among its peers and targets the allocation of 60%65% of earnings over time towards capital distributions and accretive actions;
• Meaningful progressFor PGIM, 16th consecutive year of positive institutional third-party net flows; • For Retirement, net flows of $12.6 billion for 2018, including $16 billion of pension risk transfer transactions and record Full Service plan sales; * Sales are based on annualized new business premiums. | | | | • Individual Annuities gross sales of $8.3 billion, up 40% from 2017; • Continued business growth in our short-term and long-term leadership, talent, and succession planning priorities;International Insurance, with constant dollar revenues up 3% from 2017; • For Group Insurance, gross sales of $559 million, up 27% from 2017;* • Introduction of new products and rebalancing of product mix in order to adapt to changing market conditions, diversify risks and maintain appropriate returns; • The Company’s ongoing constructive engagementContinued progress in implementing our U.S. Financial Wellness strategy, including growth in our Prudential Pathways program and the launch of LINK by Prudential, providing customers with the Federal Reserve, international regulators, and other supervisory bodies; and • Despite a challenging interest rate environment, the Company’s share price increased 28% and TSR is 33% over the last year versus a 10% increase in the Standard & Poor’s 500.personalized online experience;
• The Company’s one-year TSR placed it inconstructive engagement and advocacy with U.S. federal, state and international regulators, including its successful advocacy with the 84th percentile relativeFinancial Stability Oversight Council and the resulting decision to rescind Prudential’s designation as a nonbank systemically important financial institution; and • Our successful campaign of corporate and community engagement, including dedicated efforts to revitalize Newark, NJ and to promote education, training and meaningful employment for Veterans and military spouses throughout the 20 companies in its compensation peer group. | | | | | (1) As used throughout, sales are based on annualized new business premiums.U.S.
| | | | | | | | | | | | | | | | | | | | | | | | | | |
| | | | | | | | 48 54 | | | | | Notice of Annual Meeting of Shareholders and 20172019 Proxy Statement |
| | |
| | Compensation Discussion and Analysis | |
OTHER NEOS In the case of the other NEOs, Mr.Messrs. Lowrey and Strangfeld formulated recommendations for each individual based on the Final Performance Factor and histhe assessment of their performance and presented these recommendations to the Committee for its consideration. Based on the Final Performance Factor, as well as these recommendations and its own evaluation of their performance, the Committee recommended, and the independent members of our Board approved, the following annual incentive awards for each of the other NEOs: | | | | | | | | | | | | | | Mr. FalzonTanji | | | | | | | | | | | | | | | | | | | | | | 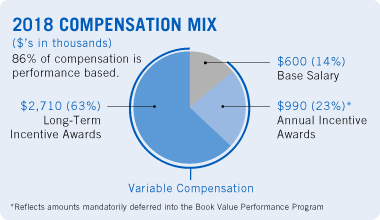 | | | | ANNUAL INCENTIVE AWARD DECISION Mr. Tanji’s incentive award was $1,100,000, or approximately 1.29 times his target award amount. Of the $1,100,000, $110,000 was mandatorily deferred into the Book Value Performance Program. | |
|
|
| | | | | | | | | | | | | | KEY PERFORMANCE ACHIEVEMENTS In assessing the individual performance of Mr. Tanji, the Committee identified and examined a broad range of corporate and individual performance factors, including: | | | | | | | • His individual development that contributed to the Company’s leadership succession plans, including the appointment of Mr. Tanji as Executive Vice President and Chief Financial Officer effective December 1, 2018; • His leadership of talent management and succession planning initiatives for the Finance organization, including the successful transition of his prior responsibilities as Senior Vice President
and Treasurer; • His acumen in capital management and cash flow planning, including the return of $3.0 billion to shareholders during 2018 through our share repurchase program and Common Stock dividends, representing an increase in shareholder distributions of approximately 20% from 2017. The Company has one of the highest dividend yields among its peers and targets the allocation of 65% of earnings over time towards capital distributions and accretive actions; | | | | • His effective oversight of our liquidity position, including $5.5 billion of highly liquid assets* at the parent company level at December 31, 2018; • His leadership of strategies to manage the impacts of the Tax Cuts and Jobs Act on our statutory capital and financial leverage position; • His role in the Company’s constructive engagement with state insurance regulators, including facilitating the completion of their first consolidated group-wide examination of Prudential with no reportable findings; and • His key role in management of the statutory capital position of our insurance companies, resulting in capital above our “AA” financial strength targeted levels for our major U.S. insurance subsidiaries and strong solvency margins in our international insurance subsidiaries as of December 31, 2018. | | | | | | | * Predominantly includes cash, short-term investments, U.S. Treasury securities, obligations of other U.S. government authorities and agencies, and/or foreign government bonds; excludes cash held in an intra-company liquidity account at Prudential Financial, Inc. | | | | | | | | | | | | | | | |
| | | | | | | | Notice of Annual Meeting of Shareholders and 2019 Proxy Statement | | | | | 55 |
| | |
| | Compensation Discussion and Analysis | |
| | | | | | | | | | | | | Mr. Falzon | | | | | | | | | | | | | | | | | | | | | | | 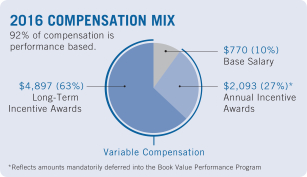 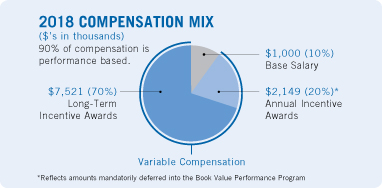 | | | | ANNUAL INCENTIVE AWARD DECISION Consistent with the Final Performance Factor, Mr. Falzon’s annual incentive award was $2,990,000$3,070,000, or approximately 0.9971.023 times his target award amount. This award compares to an annual incentive award of $2,600,000$3,330,000 for 2015,2017, representing an increasea decrease of 15.0%7.8%. Of the $2,990,000, $897,000$3,070,000, $921,000 was mandatorily deferred into the Book Value Performance Program. | |
|
|
| | | | | | | | | | | | | | | | | KEY PERFORMANCE ACHIEVEMENTS In assessing the individual performance of Mr. Falzon, the Committee identified and examined a broad range of corporate and individual performance factors, including: | | | | | | | | | | | | • His individual development that led to execution of the Company’s overall leadership succession plans, including the appointment of Mr. Falzon as Vice Chairman effective December 1, 2018; • His leadership of talent management and succession planning initiatives for the Finance organization, including the successful transition of his prior responsibilities as Chief Financial Officer to Mr. Tanji, effective December 1, 2018; • After-tax AOI of $4.11$5.02 billion and EPS, based onafter-tax AOI, of $9.13$11.69 in 2016;2018, reflecting strong core performance from our businesses. EPS, based onafter-tax AOI, increased 10.5% versus 2017; • Operating return on average equity of 12.7% for 2018, at thehigh-end of our objective of 12% for 2016, with solid core performance from our businesses partly offset byto 13% over the impact of a number of inherently variable and episodic items including our annual actuarial review;near-to-intermediate term; • His acumen in capital management and cash flow planning, including the return of $3.2$3.0 billion to shareholders during 2016,2018, through our share repurchase program and Common Stock dividends, representing over a 50% increase from 2015;dividends. The Company has one of the highest dividend yields • His leadership on initiatives to reduce the Company’s use of financial leverage, resulting in a reduction of total debt outstanding by $1.6 billion in 2016;
• His effective oversight of our liquidity position, including the maintenance of $4.5 billion* of cash and highly liquid assets at the parent company level at December 31, 2016;
| | | | • His instrumental role in restructuring our Individual Annuities business, which resulted in
among its peers and targets the initial distributionallocation of approximately $1 billion to the parent company from the restructuring65% of earnings over time towards capital distributions and a further distribution of approximately $1 billion driven by earnings and is expected to reduce capital volatility and improve earnings and cash flow prospects;accretive actions; • His key role in management of the statutory capital position of our insurance companies, resulting in a risk-based capital ratio of approximately 457% for Prudential Insurance, 867% for PALAC, and a composite risk-based capital ratioabove our “AA” financial strength targeted levels for our major U.S. insurance subsidiaries of 527%, as of December 31, 2016 and strong solvency margins atin our international insurance subsidiaries as of that date;December 31, 2018; • His effective oversight of our liquidity position, including $5.5 billion of highly liquid assets* at the parent company level at December 31, 2018; • His effective supervision of internal financial and accounting functions;functions as Chief Financial Officer; and • His leadership in the Company’s ongoing engagement and advocacy with U.S. federal, state and international regulators, including its successful advocacy with the Federal Reserve, international regulatorsFinancial Stability Oversight Council and other supervisory bodies.the resulting decision to rescind Prudential’s designation as a nonbank systemically important financial institution. | | | | | | | * IncludesPredominantly includes cash, short-term investments, and U.S. Treasury fixed maturities;securities, obligations of other U.S. government authorities and agencies, and/or foreign government bonds; excludes cash held in an intra-company liquidity account at Prudential Financial, Inc., and outstanding commercial paper. | | | | | | | | | | | | | | | |
| | | | | | | | 56 | | | | | Notice of Annual Meeting of Shareholders and 20172019 Proxy Statement | | | | 49 | |
| | |
| | Compensation Discussion and Analysis | |
| | | | | | | | | | | | | | | | Mr. Grier | | | | | | | | | | | | | | | | | | | | | | 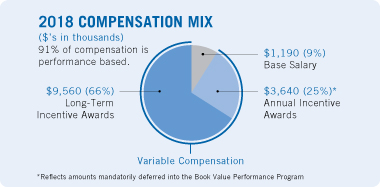 | | | 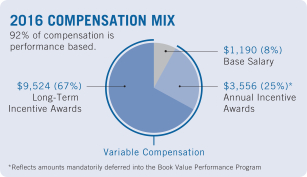 | | | | ANNUAL INCENTIVE AWARD DECISION Consistent with the Final Performance Factor, Mr. Grier’s incentive award was $5,080,000$5,200,000, or approximately 0.9961.020 times his target award amount. This award compares to an annual incentive award of $5,100,000$5,660,000 for 2015,2017, representing
a decrease of 0.4%8.1%. Of the $5,080,000, $1,524,000$5,200,000, $1,560,000 was mandatorily deferred into the Book Value Performance Program. | | | | | | | | | | | | | | | | | | KEY PERFORMANCE ACHIEVEMENTS In assessing the individual performance of Mr. Grier, the Committee identified and examined a broad range of corporate and individual performance factors, including: | | | | | | | • After-tax AOI of $4.11$5.02 billion and EPS, based onafter-tax AOI, of $9.13$11.69 in 2016;2018, reflecting strong core performance from our businesses. EPS, based onafter-tax AOI, increased 10.5% versus 2017; • Operating return on average equity of 12.7% for 2018, at thehigh-end of our objective of 12% for 2016, with solid core performance fromto 13% over the near-to-intermediate term; • Growth in adjusted book value per share of our businesses partly offset by the impactCommon Stock to $96.06 at December 31, 2018, versus $88.67 per share at December 31, 2017, an increase of a number$7.39, or 8.3%, after payment of inherently variable and episodic items including our annual actuarial review;four quarterly dividends totaling $3.60 per share; • His leadership in enhanced capital management, including the return of $3.2$3.0 billion to shareholders during 2016,2018, through our share repurchase program and Common Stock dividends, representing over a 50%an increase in shareholder distributions of approximately 20% from 2015. The Company has one of the highest dividend yields among its peers and targets the allocation of 60% of earnings towards capital distributions and accretive actions over time; • His oversight of risk management, including oversight of the restructuring of our Individual Annuities business, including enhancements to the risk management strategies to reduce capital volatility and improve earnings and cash flow prospects;
2017; | | | | • His acumen in capital deploymentoversight of risk management, including the continued implementation of new risk management frameworks and business development,risk mitigation initiatives; • Facilitating the Company’s leadership succession, including a key role in the completionongoing transition of our acquisition of a 40% stake in AFP Habitat, a leading provider of retirement services in Chile;his responsibilities to Mr. Falzon; and • His successful service as spokesman for both our Company’sCompany and an industry spokesperson regarding the evolving regulatory initiatives affecting the insurance and financial services industries,
and his leadership inof the Company’s ongoing engagementadvocacy with the Federal Reserve, international regulators and other supervisory bodies.Financial Stability Oversight Council concerning the rescinding of Prudential’s designation as a nonbank systemically important financial institution. | | | | | | | | | | | | | | | | | | | | |
| | | | | 50 | | | | Notice of Annual Meeting of Shareholders and 20172019 Proxy Statement | | | | | 57 |
| | |
| | Compensation Discussion and Analysis | |
| | | | | | | | | | | | | | | | Mr. LowreyPelletier | | | | | | | | | | | | | | | | | |  | | | | ANNUAL INCENTIVE AWARD DECISION
Consistent with the Final Performance Factor, Mr. Lowrey’s incentive award was $3,985,000 or approximately 0.996 times his target award amount. This award compares to an annual incentive award of $4,250,000 for 2015, representing a decrease of 6.2%. Of the $3,985,000, $1,195,500 was mandatorily deferred into the Book Value Performance Program.
| | | | | | | | | | | | | | KEY PERFORMANCE ACHIEVEMENTS
In assessing the individual performance of Mr. Lowrey, the Committee identified and examined a broad range of corporate and individual performance factors, including:
| | | | | • His efforts in leading our International Businesses to earnpre-tax AOI of $3.1 billion for 2016, a 3% increase from 2015 before the impact of changes in currency exchange rates;
• His role in achieving an 8% increase in constant dollar sales in 2016 compared to 2015;
• His oversight of our distribution through Life Planner operations, which achieved constant dollar sales of $1.3 billion in 2016, representing a 10% increase from 2015;
• His leadership in the active management of proprietary and third party distribution at Gibraltar Life, which achieved constant dollar sales of $1.7 billion in 2016, representing a 7% increase from 2015;
| | | | • His contributions to the successful adaptation to current market conditions of major product lines serving death protection and retirement needs in our key international markets through multiple distribution channels including a 53% increase in U.S. dollar product sales in Japan in 2016 compared to 2015;
• His role in helping drive expansion into new markets outside of Japan, including a key role in our acquisition of a 40% stake in AFP Habitat, a leading provider of retirement services in Chile, and ourstep-up in ownership percentage from 26% to 49% in DHFL Pramerica, our joint venture in India; and
• His overall leadership of the International Businesses including comprehensive succession planning.
| | | | | | | | | | | |
| | | | | | | Notice of Annual Meeting of Shareholders and 2017 Proxy Statement | | | | 51 | |
| | | | | Compensation Discussion and Analysis
|
| | | | | | | | | | | Mr. Pelletier
| | | | | | | | | | | | | | | | | | 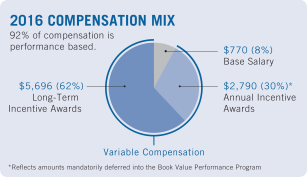 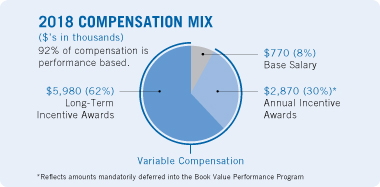 | | | | ANNUAL INCENTIVE AWARD DECISION Consistent with the Final Performance Factor, Mr. Pelletier’s incentive award was $3,985,000$4,100,000, or approximately 0.9961.025 times his target award amount. This award compares to an annual incentive award of $3,200,000$4,700,000 for 2015,2017, representing an increasea decrease of 24.5%12.8%. Of the $3,985,000, $1,195,500$4,100,000, $1,230,000 was mandatorily deferred into the Book Value Performance Program. | | | | | | | | | | | | | | | | | | KEY PERFORMANCE ACHIEVEMENTS In assessing the individual performance of Mr. Pelletier, the Committee identified and examined a broad range of corporate and individual performance factors, including: | | | | | • His efforts in leading our Retirement business to achieve account values of $386 billion at December 31, 2016, a 5% increase from a year earlier;
| | • His instrumental roleleadership of the U.S. Businesses and implementation of our Financial Wellness strategy, including: • the launch of LINK by Prudential, providing customers with a personalized online experience; • growth in our Prudential Pathways program; and • enhanced customer engagement strategies such as a digital financial wellness platform; • For PGIM, 16th consecutive year of positive institutional third-party net flows; • Retirement net flows of $12.6 billion for 2018, including the continued expansion of our leading position in the pension risk transfer market, including the completion of approximately $5with $16 billion of new funded casespension risk transfer transactions in 2016;2018 and record Full Service plan sales in 2018; • His contributions to the success of our Asset Management* Sales are based on annualized new business which had $1.04 trillion of assets under management as of December 31, 2016, up 8% from a year earlier, marking the 14th consecutive year of net positive institutional flows;
• His oversight of our Individual Life Insurance business, which produced a 7% increase in sales in 2016, as compared to a year earlier;
premiums. | | | | • His oversightIndividual Annuities gross sales of $8.3 billion, up 40% from 2017; • Enhancing collaboration across our U.S. and International Businesses, including expansion of our Individual Annuities business which recorded a 3% increase in account values asFinancial Wellness platforms; • For Group Insurance, gross sales of December 31, 2016 compared to a year earlier, while successfully executing product diversification strategies and a restructuring that is expected to reduce capital volatility and improve earnings and cash flow prospects;$559 million, up 27% from 2017;* • His role in the improved resultsintroduction of our Group Insurance business, which recordedpre-tax adjusted operating incomenew products and rebalancing of $220 million for 2016, an increase of 25% from 2015;product mix in order to adapt to changing market conditions, diversify risks and maintain appropriate returns; and • His overall leadership ofrole in talent management and succession planning for the U.S. Businesses, including cross-business initiativesthe transition of several new leadership positions within the organization. | | | | | | | | | | | | | |
| | | | | | | | 58 | | | | | Notice of Annual Meeting of Shareholders and comprehensive succession planning.2019 Proxy Statement |
| | |
| | Compensation Discussion and Analysis | |
| | | | | | | | | | | | | | | Mr. Sleyster | | | | | | | | | | | | | | | | | | | | | | 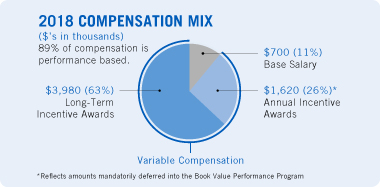
| | | | ANNUAL INCENTIVE AWARD DECISION Mr. Sleyster’s incentive award was $1,800,000, or approximately 1.17
times his target award amount. Of the $1,800,000, $180,000 was mandatorily deferred into the Book Value Performance Program. | | | | | | | | | | | | | | | | | | KEY PERFORMANCE ACHIEVEMENTS In assessing the individual performance of Mr. Sleyster, the Committee identified and examined a broad range of corporate and individual performance factors, including: | | | | | | | • His individual development that contributed to the Company’s leadership succession, including the appointment of Mr. Sleyster as Executive Vice President and Chief Operating Officer, International Businesses effective December 1, 2018 and the successful transition of the role of Chief Investment Officer; • His role as Chief Investment Officer and leadership of the overall investment function during 2018, including the generation of net investment income (excludingnon-coupon investments and prepayment fee and call premium income) of $3.3 billion in 2018, an increase of 4% from 2017; • His oversight of the Company’s variable annuities hedging program and other risk mitigation initiatives; • His partnership with the Company’s businesses on numerous product enhancements and the development of comprehensive asset/liability matching strategies for all product offerings; | | | | • His leadership in growing the Company’s alternative asset strategy, which has included investments in limited partnerships and limited liability companies, real estate, derivative instruments and other investments; • His role in supporting strategic priorities of the International Businesses, including the advancement of our business strategy in Asia and Africa; and • His leadership in integratingESG-related investment initiatives into the investment function and leading anESG-based dialogue across our businesses. | | | | | | | | | | | | | |
| | | | | | | | Notice of Annual Meeting of Shareholders and 2019 Proxy Statement | | | | | 59 |
| | |
| | Compensation Discussion and Analysis | |
Long-Term Incentive Program We provide a long-term incentive opportunity to motivate and reward our executive officers for their contributions toward achieving our business objectives by tying these incentives to the performance of our Common Stock and book value over the long term, to further reinforce the link between the interests of our executive officers and our shareholders, and to motivate our executive officers to improve our multi-yearmultiyear financial performance. TARGET AWARD OPPORTUNITIES In February 2019, the Committee established a target long-term award opportunity for each of the NEOs (other than Mr. Strangfeld). To set these long-term award targets, the Committee considered: a competitive market analysis of the NEO’s total compensation and the portion of total compensation provided as long-term incentives, relative to similar roles at companies in our compensation peer group; the NEO’s individual performance and his or her expected future contributions; the NEO’s level of experience in his or her role; and retention considerations. The specific long-term target award opportunity for each NEO (other than Mr. Strangfeld) is as follows: | | | | | | | | Named Executive Officers | | Target Long-Term Award Opportunity | | | | | Charles F. Lowrey | | | $8,300,000 | | | | | Kenneth Y. Tanji | | | $2,600,000 | | | | | Robert M. Falzon | | | $6,600,000 | | | | | Mark B. Grier | | | $8,000,000 | | | | | Stephen Pelletier | | | $4,750,000 | | | | | Scott G. Sleyster | | | $3,800,000 | | | |
Our practice is to grant long-term incentive awards annually in the form of a balanced mix of performance shares and units, stock options, and book value units to our officers at the level of senior vice president and above, including the NEOs, in amounts that are consistent with competitive practice. The mix of long-term incentives granted in 20162019 to the NEOs is shown in the table below: | | | | | | Performance Shares and Units | | | 60 | % | | Stock Options | | | 20 | % | | Book Value Units | | | 20 | % |
In determining the amount of individual long-term incentive awards, the Committee considers a senior executive’s individual performance during the immediately preceding year, potential future contributions, his or her prior year’s award value, and retention considerations, as well as market data for the executive officer’s position at the companies in the Peer Group.
| | | | | 52 | | | Notice of Annual Meeting of Shareholders and 2017 Proxy Statement |
| | | | | Compensation Discussion and Analysis
|
Long-term incentive awards may also be granted when an individual is promoted to a senior executive position to recognize the increase in the scope of his or her role and responsibilities. From time to time, we may make special awards in the form of restricted stock units to recognize major milestones, or selective awards in situations involving a leadership transition. In addition, for all long-term incentive awards granted in 2014 or earlierprior to any NEO who is subject to Section 162(m), the total payout amount for performance shares and units, restricted stock units, and book value units, as well as the 2016 annual incentive payment, may not exceed 0.6% of ourpre-tax AOI for the prior year. For all such long-term awards granted in 2015 and subsequent years,2019, the total payout amount to any NEO subject, or who would have otherwise been subject, to Section 162(m) may not exceed 0.4% of the highestpre-tax AOI reported for any of the three fiscal years ended prior to the year of payment, provided that there is positive AOI in at least one fiscal year during which the award is outstanding for at least 276 days of that year. For annual incentive payments relating to 2017 and subsequent performance years, there is a separate limit for any NEO subject to Section 162(m) of 0.4% of ourpre-tax AOI for the applicable performance year. | | | | | | | | 60 | | | | | Notice of Annual Meeting of Shareholders and 2019 Proxy Statement |
| | |
| | Compensation Discussion and Analysis | |
PERFORMANCE SHARES AND UNITS Performance shares and units align the majority of our long-term incentive values toto: (i) the achievement of our key ROE goalsobjective and (ii) our relative ROE performance as compared to our life insurer peers, in each case over a three-year performance period. Starting with the February 2014 awards with respect to the 2014 to 2016 performance period, awardAward payouts generally range from 0% to 125% of the target number of shares and units. In past years, maximum awards ranged up to 150% of the target number of shares. Beginning with the February 2014 awards with respect to the 2014 to 2016 performance period and ending withFor the February 2016 awards with respect to the 2016 to 2018 performance period, the preliminary payout will bewas based on the average ROE achievement over the three-year performance period relative to the goals set at the start of the period as established by the Committee. Also, for the February 2015 awards with respectCommittee, subject to the 2015 to 2017 performance period and the February 2016 awards with respect to the 2016 to 2018 performance period, we used a relative performance modifier. The modifier providedprovides a balance between absolute performance and performance relative to the North American Life Insurance subset of the Peer Group and is based on the Company’s three-year performance in ROE, book value per share growth and EPS growth. The modifier increasesincreased or decreasesdecreased the award payment by up to 10% within the 0% to 125% range.
Beginning withFor the February 2017remaining awards, with respect to the 2017 to 2019 performance period, the preliminary payout will beis based on two equally-weightedequally weighted financial metrics: (i) average ROE achievement over the three-year performance period relative to the goals set at the start of the period as established by the Committee and (ii) average ROE achievement over the three-year performance period relative to the median ROE results over this period of the North American Life Insurance subset of the Peer Group. This change tomethodology for the performance shares and units program further solidifies the balance between absolute performance and performance relative to our life insurer peers. Accordingly, the use of a relative performance modifier was eliminated starting with the February 2017 awards.
In addition, the February 2018 awards with respect to the 2018 to 2020 performance period granted to officers at the senior vice president level and above and equivalents (including the NEOs) are subject to a modifier that can increase (or decrease) the payout by up to 10% based on the achievement of our diversity and inclusion goals over the three-year performance period. Performance unit awards are denominated in share equivalents and have the same value as the performance share awards on the award payment date. Dividend equivalents are paid retroactively on the final number of performance shares and units paid out, up to the target number of shares and units. ROE is determined usingafter-tax AOI divided by adjusted book value. The ROE figures are also subject to standard adjustments as part of ourpre-set established formulaic framework. While the program allows the Committee to make a discretionary adjustment by up to 15% of the earned shares and units based on quantitative and qualitative factors, the Committee has rarely exercised discretion and did not exercise discretion for the 20142016 awards that paid out in February 2017.2019. STOCK OPTIONS Stock options provide value based solely on stock price appreciation. Stock options are granted with a maximum term of ten10 years.One-third of the option grants vest on each of the first three anniversaries of the date of grant. The exercise price is based on the closing market price of a share of our Common Stock on The New York Stock Exchangethe NYSE on the date of grant. | | | | | | | Notice of Annual Meeting of Shareholders and 2017 Proxy Statement | | | | 53 | |
| | | | | Compensation Discussion and Analysis
|
BOOK VALUE PERFORMANCE PROGRAM The Book Value Performance Program is intended to link the incentive payments to a measure ofadjusted book value per share—a key metric in valuing insurance companies, banks, and investment firms that is closely followed by investors. We calculate adjusted book value per share by dividing our adjusted book value by the number of shares of our Common Stock outstanding. Our calculations of adjusted book value and adjusted book value per share, as described in Appendix A to this Proxy Statement, exclude certain balance sheet items that are not, and may never be, reflected in the income statement. Unlike the financial measures based on AOI that are used in other aspects of our executive compensation program, the adjusted book value per share metric takes into consideration realized gains and losses in our investment portfolio. The Tax Cuts and Jobs Act enacted in December 2017 has had a beneficial impact on our adjusted book value due to the remeasurement of net deferred tax liabilities resulting from the reduction in the U.S. tax rate. The Committee excludes this benefit from the calculation of adjusted book value per share for purposes of valuing the book value units that were granted prior to enactment of the Tax Cuts and Jobs Act. | | | | | | | | Notice of Annual Meeting of Shareholders and 2019 Proxy Statement | | | | | 61 |
| | |
| | Compensation Discussion and Analysis | |
The key features of the Book Value Performance Program for our NEOs are: Awards are granted and denominated in book value units that are funded from two sources: | | – | | the allocation of 20% of a participant’s long-term incentive award value for the year as determined by the Committee; and |
| | – | | a mandatory deferral of 30% of their annual incentive award. |
Once granted, the value of these book value units then tracks changes in book value per share for each participant. These units track the value of adjusted book value per share of our Common Stock, excludingwhich excludes total accumulated other comprehensive income and thenon-economic effects of foreign currency exchange rate remeasurement ofnon-yen liabilities and assets included in net income or loss.
One-third of a participant’s annual award of book value units is distributed in cash in each of the three years following the year of grant. 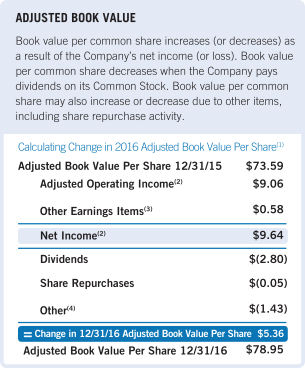 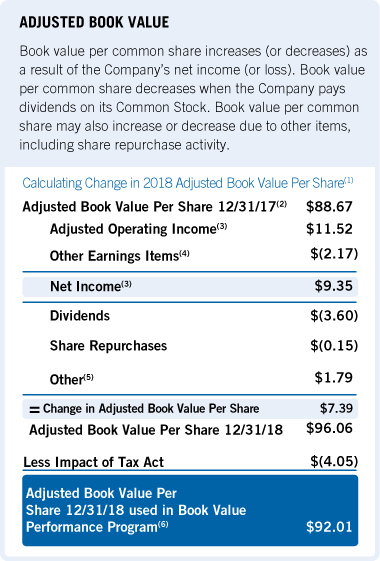
| (1) | Excluding total accumulated other comprehensive income, and the cumulative impact of gains and losses resulting from foreign currency exchange rate remeasurement and the remeasurement of certain deferred taxes included in net income (loss).income. |
| (2) | December 31, 2017 amount has been revised as a result of the elimination of Gibraltar Life’sone-month reporting lag in 2018. |
| (3) | Does not include the impact of changes in share count or adjustments to earnings for purposes of calculating diluted earnings per share. |
(3)(4) | Includes realized investment gains and losses and related charges and adjustments, and results from divested and run-off businesses. |
(4)(5) | Includes the impact of the Company’s settlement of Class B shares, amounts related to the cumulative effect of changes in accounting principles and foreign currency exchange rate remeasurement formerly recorded in accumulated other comprehensive income,income. |
| (6) | Used for grants of book value units made prior to the enactment of the Tax Cuts and changesJobs Act in share count other than as a result of share repurchases.December 2017. |
For a reconciliation of Adjusted Book Value to the most comparable GAAP measure, see Appendix A to this Proxy Statement. | | | | | 54 | | | 62 | | | | | Notice of Annual Meeting of Shareholders and 20172019 Proxy Statement |
| | |
| | Compensation Discussion and Analysis | |
The NEOs’ awards, distributions and accumulated holdings under the Book Value Performance Program are as follows: | | | | Number of Book
Value Units
Held at
January 1, 2016
(#) | | Value of Book
Value Units Held at
January 1, 2016(1)
($) | | Value of Book Value Units
Distributed in 2016(2)
($) | | Value of Book
Value Units
Awarded in 2016(3)
($) | | Number of Book
Value Units Held at
December 31, 2016
(#) | | Value of Book
Value Units Held at
December 31,
2016(4) ($) | | | | | | | Number of Book
Value Units
Held at
January 1, 2018
(#) | | Value of Book
Value Units Held at
January 1, 2018(¹)
($) | | Value of Book Value
Units
Distributed in 2018(²)
($) | | Number of Book
Value Units
Awarded in 2018
(#) | | Value of Book
Value Units
Awarded in 2018(³)
($) | | Number of Book
Value Units Held at
December 31, 2018
(#) | | Value of Book
Value Units Held at
December 31,
2018(4) ($) | | | Charles F. Lowrey | | | 60,942 | | | 5,212,979 | | | 2,764,738 | | | 25,851 | | | 2,282,126 | | | 54,472 | | | 5,116,665 | | | | John R. Strangfeld | | 126,729 | | | $ | 9,325,987 | | | $ | 4,612,768 | | | $ | 3,774,578 | | | 115,339 | | | $ | 9,106,014 | | | 103,036 | | | 8,813,699 | | | 4,611,376 | | | 66,298 | | | 5,998,170 | | | 115,425 | | | 10,888,761 | | | | Kenneth Y. Tanji | | | 7,824 | | | 669,265 | | | 349,602 | | | 3,733 | | | 329,549 | | | 7,470 | | | 702,433 | | | | Robert M. Falzon | | 39,789 | | | $ | 2,928,073 | | | $ | 1,266,410 | | | $ | 1,580,124 | | | 44,052 | | | $ | 3,477,905 | | | 43,996 | | | 3,763,418 | | | 1,925,249 | | | 20,380 | | | 1,799,146 | | | 41,869 | | | 3,934,906 | | | | Mark B. Grier | | 105,300 | | | $ | 7,749,027 | | | $ | 3,840,736 | | | $ | 3,130,077 | | | 95,643 | | | $ | 7,551,015 | | | 85,174 | | | 7,285,784 | | | 3,816,282 | | | 37,360 | | | 3,298,141 | | | 77,920 | | | 7,320,727 | | | Charles F. Lowrey | | 79,723 | | | $ | 5,866,816 | | | $ | 2,902,390 | | | $ | 2,225,067 | | | 70,519 | | | $ | 5,567,475 | | | | | Stephen Pelletier | | 44,059 | | | $ | 3,242,302 | | | $ | 1,356,705 | | | $ | 1,860,061 | | | 50,899 | | | $ | 4,018,476 | | | 53,692 | | | 4,592,814 | | | 2,358,338 | | | 26,734 | | | 2,360,078 | | | 52,856 | | | 4,971,553 | | | | Scott G. Sleyster | | | 21,765 | | | 1,861,778 | | | 915,192 | | | 12,370 | | | 1,092,024 | | | 23,436 | | | 2,206,445 | | |
1(1) | Represents the aggregate market value of the number of book value units held at January 1, 20162018 obtained by multiplying the book value per share of $73.59$85.54 as of December 31, 20152017 by the number of book value units outstanding. |
2(2) | Represents the aggregate market value distributed on February 19, 2016March 2, 2018 for all NEOs and also for Mr. Pelletier on April 12, 2016.NEOs. |
3(3) | Represents the aggregate market value awarded on February 9, 201613, 2018 for all NEOs.NEOs, and November 30, 2018 for Mr. Strangfeld. |
4(4) | Represents the aggregate market value of the number of book value units held at December 31, 20162018, obtained by multiplying the book value per share of $78.95 as of December 31, 2016$96.06 by the number of outstanding book value units outstanding.granted in 2018, and multiplying the book value per share (adjusted for tax reform legislation) of $92.01 by the number of outstanding book value units granted prior to 2018. |
LONG-TERM INCENTIVE AWARD DECISIONS FOR 20162018 In connection with the retirement of John R. Strangfeld as CEO, in November 2018, the Committee granted a long-term incentive award to Mr. Strangfeld for the 2018 performance year of $10 million to reward performance and long-term value creation. The award is equal to the target long-term incentive award opportunity established by the Committee for Mr. Strangfeld for 2018. In approving this award, the Committee considered a number of factors, including Mr. Strangfeld’s nearly full year of service in 2018, his long service as a high performing CEO, his agreement to remain on the Board through a transition period ending on April 5, 2019 and his key role in supporting a smooth leadership succession, which the Committee and the Board believe will drive continued value creation. In February 2017,2019, the Committee granted long-term incentive awards to each of the NEOs other than Mr. Strangfeld. The award amount was based on updatedupon the competitive analysis of long-term incentive compensation and total direct compensation for each of the NEOs. To determine the amount of the specific long-term incentive award for each NEO, the Committee considered each individual’s performance during 2018 and market data for the comparable executive officer position at the companies in the Peer Group, as well as his or her potential future contributions to the Company, the current value of prior year long-term incentive awards and its assessment of their individual performance during 2016. retention considerations. These awards, including Mr. Strangfeld’s award, were granted in the form of performance shares (30%), performance units (30%), stock options (20%), and book value units (20%) under the Book Value Performance Program (in addition to the mandatory deferral of 30% of each NEO’s annual incentive award)award under this program). TheWith respect to the NEOs (other than Mr. Strangfeld, whose award is discussed below), the Committee determined that this long-term incentive mix would appropriately reward the NEOs for their 20162018 performance, motivate them to work towards achieving our long-term objectives, further reinforce the link between their interests and the interests of our shareholders, and provide a balanced portfolio composed of performance shares and units (which provide value based upon attainment of specific performance goals and performance relative to peers), stock options (which provide value based solely on stock price appreciation) and book value units (which provide value based on changes in our adjusted book value per share). | | | | | | | | Notice of Annual Meeting of Shareholders and 2019 Proxy Statement | | | | | 63 |
| | |
| | Compensation Discussion and Analysis | |
The following table presents the long-term incentive awards granted to Mr. Strangfeld in November 2018 and to each other NEO in February 2017,2019, including our Book Value Performance Program, and includes the mandatory deferrals of 30% of their annual incentive award. Awards are expressed as target compensation dollar compensation values in the table. TheseThe 2019 awards generally will not be reported in the Summary Compensation Table until 2018.the 2020 Proxy Statement. For discussion of the long-term incentive awards granted in February 20162018 for 20152017 performance and included in this year’s Summary Compensation Table, see the CD&A in our 20162018 Proxy Statement. | | | Named Executive Officer | |
| Compensation Value of
Book Value Units(1) |
| |
| Compensation Value of
Stock Options |
| |
| Compensation Value of
Performance Shares |
| |
| Compensation Value of
Performance Units |
| | | Total | | |
| Compensation Value of
Book Value Units(1) |
| |
| Compensation Value of
Stock Options |
| |
| Compensation Value of
Performance Shares |
| |
| Compensation Value of
Performance Units |
| | | Total | | Charles F. Lowrey | | | | 2,890,000 | | | | 1,660,000 | | | | 2,490,000 | | | | 2,490,000 | | | | 9,530,000 | | | | John R. Strangfeld | | $ | 3,792,800 | | | $ | 2,000,000 | | | $ | 3,000,000 | | | $ | 3,000,000 | | | $ | 11,792,800 | | | | 3,839,600 | | | | 2,000,000 | | | | 3,000,000 | | | | 3,000,000 | | | | 11,839,600 | | | Kenneth Y. Tanji | | | | 630,000 | | | | 520,000 | | | | 780,000 | | | | 780,000 | | | | 2,710,000 | | | | Robert M. Falzon | | $ | 1,697,000 | | | $ | 800,000 | | | $ | 1,200,000 | | | $ | 1,200,000 | | | $ | 4,897,000 | | | | 2,241,000 | | | | 1,320,000 | | | | 1,980,000 | | | | 1,980,000 | | | | 7,521,000 | | | | Mark B. Grier | | $ | 3,124,000 | | | $ | 1,600,000 | | | $ | 2,400,000 | | | $ | 2,400,000 | | | $ | 9,524,000 | | | | 3,160,000 | | | | 1,600,000 | | | | 2,400,000 | | | | 2,400,000 | | | | 9,560,000 | | | Charles F. Lowrey | | $ | 2,195,500 | | | $ | 1,000,000 | | | $ | 1,500,000 | | | $ | 1,500,000 | | | $ | 6,195,500 | | | | | Stephen Pelletier | | $ | 2,095,500 | | | $ | 900,000 | | | $ | 1,350,000 | | | $ | 1,350,000 | | | $ | 5,695,500 | | | | 2,180,000 | | | | 950,000 | | | | 1,425,000 | | | | 1,425,000 | | | | 5,980,000 | | | Scott G. Sleyster | | | | 940,000 | | | | 760,000 | | | | 1,140,000 | | | | 1,140,000 | | | | 3,980,000 | | |
1(1) | Includes amounts that were mandatorily deferred from the Annual Incentive Program (30%)(10% for Messrs. Tanji and Sleyster; 30% for other NEOs) that total $1,792,800$1,230,000 for Mr. Lowrey, $1,839,600 for Mr. Strangfeld; $897,000$110,000 for Mr. Tanji, $921,000 for Mr. Falzon; $1,524,000$1,560,000 for Mr. Grier; $1,195,500$1,230,000 for Mr. Lowrey,Pelletier, and $1,195,500$180,000 for Mr. Pelletier. |
| | | | | | | Notice of Annual Meeting of Shareholders and 2017 Proxy Statement | | | | 55 | |
| | | | | Compensation Discussion and Analysis
Sleyster. |
PERFORMANCE SHARE AND PERFORMANCE UNIT AWARDS The NEOs currently have three performance share and unit awards outstanding. In February 2017,2019 (or November 2018, in the case of Mr. Strangfeld), the Committee granted the performance share and unit awards for the 20172019 to 20192021 performance period. The key features of these three awards are as follows: | | | | | | | | | | | | | | Performance Period | | Performance Measures | | Performance Measure Target LevelsTargets
| | Target Number of Shares/
Units to beBe Awarded
Relative to Performance
Measure Targets | | Actual Number of Shares/Units Awarded | 2015–2017 | | - ROE
- Relative Performance:
ROE Book value per share growth
EPS growth
| | Average ROE of 13.5% for the 2015 through 2017 performance period. Weighted average relative performance ranking of 4 on relative ROE, book value per share growth and EPS growth. | | 100% at target level and
125% if average ROE is 14% or more, in each case, assuming a relative performance modifier of zero.
| | To be determined between 0% and 125% of the target number by the Committee in February 2018 based on average ROE over the 2015-2017 performance period compared to the Company’s ROE targets, as modified by the relative performance modifier. | 2016–2018 | | - ROE
- Relative Performance:
ROE
Book value per share growth
EPS growth
| | Average ROE of 13% for the 2016 through 2018 performance period. Weighted average relative performance ranking of 4 on relative ROE, book value per share growth and EPS growth. | | 100% at target level and
125% if average ROE is 14% or more, in each case, assuming a relative performance modifier of zero.
| | To be determined between 0% and 125% of the target number by the Committee in February 2019 based on average ROE over the 2016-2018 performance period compared to the Company’s ROE targets, as modified by the relative performance modifier. | | 2017–2019 | | - ROE and - Relative ROE versus life insurer peer group Weighted equally | | Average ROE of 12% for the performance period and Average ROE performance equal to the median performance of the North American Life Insurance subset of the Peer Group for the 2017 through 2019 performance period.period | | ROE Measure 0% at 9.5% ROE or below 100% at target levelROE of 12% 125% at 13.5% ROE or above Relative ROE Measure 0% if relative ROE trails peer group by 4% or more 100% if relative ROE equals peer group 125% if relative ROE exceeds peer group by 3% or more | | Between 0% and 125% ifof the target award opportunity based on: • average ROE is 13.5% or more relative to performance measure targets (as shown to the left) and • average ROE performance exceedsrelative to the median performance of the North American Life Insurance subset of the Peer Group by 3% or more. | | (as shown to the left) To be determined between 0% and 125% of the target number by the Committee in February 2020 based on average | | 2018–2020 | | - ROE overand - Relative ROE versus life insurer peer group Weighted equally - Diversity and Inclusion Objective | | Average ROE of 12.5% for the 2017-2019 performance period compared to the Company’s and Average ROE targets and ROE performance as comparedequal to the median performance of the North American Life Insurance subset of the Peer Group.Group for the performance period Diversity and Inclusion Objective: Improve representation of diverse persons in senior management by 5 percentage points over 2018 through 2020 performance period | | ROE Measure 0% at 10% ROE or below 100% at target ROE of 12.5% 125% at 14% ROE or above Relative ROE Measure 0% if relative ROE trails peer group by 4% or more 100% if relative ROE equals peer group 125% if relative ROE exceeds peer group by 3% or more Employee Diversity –10% if representation decreases by 2 percentage points or more –5% if no change in representation +10% if representation increases by 5 percentage points or more | | Between 0% and 137.5% of the target award opportunity based on: • average ROE relative to performance measure targets (as shown to the left) and • average ROE relative to the median performance of the North American Life Insurance subset of the Peer Group (as shown to the left) and • change in the representation of diverse persons in senior management (as shown to the left) To be determined by the Committee in February 2021 | | 2019–2021 | | - ROE and - Relative ROE versus life
insurer peer group Weighted equally | | Average ROE of 12.5% for the performance period and Average ROE equal to the median performance of the North American Life Insurance subset of the Peer Group for the performance period | | ROE Measure 0% at 10% ROE or below 100% at target ROE of 12.5% 125% at 14% ROE or above Relative ROE Measure 0% if relative ROE trails peer group by 4% or more 100% if relative ROE equals peer group 125% if relative ROE exceeds peer group by 3% or more | | Between 0% and 125% of the target award opportunity based on: • average ROE relative to performance measure targets (as shown to the left) and • average ROE relative to the median performance of the North American Life Insurance subset of the Peer Group (as shown to the left) To be determined by the Committee in February 2022 |
| | | | | | 64 | | | Notice of Annual Meeting of Shareholders and 2019 Proxy Statement |
| | |
| | Compensation Discussion and Analysis | |
In February 2016,Performance Goals
The Performance Shares and Units Program aligns long-term compensation to the achievement of our multiyear ROE goals and our relative performance as compared to our North American life insurer peers. Under the 2017-2019 program, our target ROE objective was 12%. Based on updated multiyear ROE projections that consider the estimated impact of the Tax Cuts and Jobs Act, the target ROE objective under the 2018-2020 and 2019-2021 programs was increased to 12.5%. As indicated in the previous table, the threshold level of ROE performance to earn any award, and the ROE achievement required to earn a maximum award, have been aligned to these changes in our multiyear ROE goals. For awards granted for the 2016 awards,2016-2018 and 2017-2019 performance periods, the Committee alignedexcluded the target award opportunity to 13% average ROE during the performance period, recognizing that 13% ROE represents second quartile performance relative to the North American Life Insurance subsetimpact of the Peer Group.Tax Cuts and Jobs Act from the calculation of the Company’s ROE for 2017 and 2018 and expects to similarly exclude this impact from the ROE calculations for 2019. 2016-2018 Performance Period In February 2017, for the 2017 awards, the Committee aligned the target award opportunity to 12% average ROE during the performance period, recognizing that the Company has changed its near-to-intermediate term ROE target from 13% to 14% to 12% to 13%, reflecting a sustained low interest rate environment, and that 12% ROE exceeds the estimated ROEs of its closest comparable peers within the North American Life Insurance subset of the Peer Group. In February 2017,2019, the NEOs received payouts with respect to the performance share and unit awards that were granted in February 20142016 for the three-year performance period ended December 31, 2016.2018. These awards were paid at 1.251.142 times the target number of shares and units initially awarded based on our average ROE relative to our ROE targets for the
three-year performance period.period, and adjusted for the relative performance modifier. | | | | | | | | Average ROE over the 2014-20162016-2018 Performance Period | | Goal: | | | 13.0% | | Actual(1): | | | 13.35% | | Earnout Factor: | | | 13.5% | | | 1.142 Actual(1):
| | | 14.3% | | Earnout Factor:
| | | 1.25 | |
| (1) | Actual figures adjusted forone-time items and Standard & Poor’s 500 performanceare subject to standard adjustments as under the Annual Incentive Program for each year. |
The final award payments to the NEOs in February 20172019 for the 20142016 to 20162018 performance period were: | | | Named Executive Officers | | Target Number of Shares/Units Awarded(1) | | | Actual Number of Shares/Units Awarded(1) | | | Target
Number of
Shares/Units
Awarded(1) | | Actual
Number of
Shares/Units
Awarded(1) | Charles F. Lowrey | | | | | 39,480 | | | | | 45,088 | | John R. Strangfeld | | | 57,726 | | | | 72,158 | | | | | 83,116 | | | | | 94,920 | | Kenneth Y. Tanji | | | | | 5,818 | | | | | 6,646 | | Robert M. Falzon | | | 17,658 | | | | 22,074 | | | | | 33,246 | | | | | 37,968 | | Mark B. Grier | | | 47,540 | | | | 59,426 | | | | | 66,492 | | | | | 75,934 | | Charles F. Lowrey | | | 30,562 | | | | 38,204 | | | Stephen Pelletier | | | 20,674 | | | | 25,844 | | | | | 37,402 | | | | | 42,714 | | Scott G. Sleyster | | | | | 21,610 | | | | | 24,680 | |
1(1) | Target and actual number of awards are 50% shares and 50% units. |
| | | | | | | | 56 | | | Notice of Annual Meeting of Shareholders and 20172019 Proxy Statement | | | | | 65 |
| | |
| | Supplemental Compensation Analysis | |
Supplemental Compensation Analysis TOTAL DIRECT COMPENSATION The following table illustrates the Committee’s perspective on the total direct compensation (base salary, annual incentive award, and long-term incentives) of the NEOs for the 20152017 and 20162018 performance years. This table is not a substitute for the compensation tables required by the SEC and included under “Compensation of Named Executive Officers”“Executive Compensation” contained in this Proxy Statement. However, we believe it provides a more accurate picture of how the Committee viewed its compensation actions for the NEOs based on our performance for each of these two years: | Named Executive Officer | | 2015 Compensation | | 2016 Compensation | | Percentage Change | | | | | | | | | 2017
Compensation | | 2018
Compensation | | Percentage
Change | | Charles F. Lowrey | | | | | | | | | | | | Base Salary | | | | | | | | $ 770,000 | | | $ 1,200,000 | (¹) | | 55.84% | | Annual Incentive | | | | | | | | $ 4,440,000 | (²) | | $ 4,100,000 | (³) | | -7.66% | | Long-Term Incentive(4) | | | | | | | | $ 4,750,000 | | | $ 8,300,000 | | | 74.74% | | Total | | | | | | | | $ 9,960,000 | | | $13,600,000 | | | 36.55% | | John R. Strangfeld | | | | | | | | | | | | | | | | | Base Salary | | $ | 1,400,000 | | | $ | 1,400,000 | | | 0.00% | | | | | | | | $ 1,400,000 | | | $ 1,400,000 | (¹) | | 0.00% | | Annual Incentive | | $ | 5,915,000 | (1) | | $ | 5,976,000 | (2) | | 1.03% | | | | | | | | $ 6,660,000 | (²) | | $ 6,132,000 | (³) | | -7.93% | | Long-Term Incentive(3) | | $ | 10,000,000 | | | $ | 10,000,000 | | | 0.00% | | | Long-Term Incentive(4) | | | | | | | | $10,000,000 | | | $10,000,000 | | | 0.00% | | Total | | | | | | | | $18,060,000 | | | $17,532,000 | | | -2.92% | | Kenneth Y. Tanji(5) | | | | | | | | | | | | Base Salary | | | | | | | | — | | | $ 600,000 | (¹) | | | — | | Annual Incentive | | | | | | | | — | | | $ 1,100,000 | (³) | | | — | | Long-Term Incentive(4) | | | | | | | | — | | | $ 2,600,000 | | | | — | | Total | | $ | 17,315,000 | | | $ | 17,376,000 | | | 0.35% | | | | | | | | — | | | $ 4,300,000 | | | | — | | Robert M. Falzon | | | | | | | | | | | | | | | | | Base Salary | | $ | 700,000 | (4) | | $ | 770,000 | | | 10.00% | | | | | | | | $ 770,000 | | | $ 1,000,000 | (¹) | | 29.87% | | Annual Incentive | | $ | 2,600,000 | (1) | | $ | 2,990,000 | (2) | | 15.00% | | | | | | | | $ 3,330,000 | (²) | | $ 3,070,000 | (³) | | -7.81% | | Long-Term Incentive(3) | | $ | 4,000,000 | | | $ | 4,000,000 | | | 0.00% | | | Long-Term Incentive(4) | | | | | | | | $ 4,000,000 | | | $ 6,600,000 | | | 65.00% | | Total | | $ | 7,300,000 | | | $ | 7,760,000 | | | 6.30% | | | | | | | | $ 8,100,000 | | | $10,670,000 | | | 31.73% | | Mark B. Grier | | | | | | | | | | | | | | | | | Base Salary | | $ | 1,190,000 | | | $ | 1,190,000 | | | 0.00% | | | | | | | | $ 1,190,000 | | | $ 1,190,000 | | | 0.00% | | Annual Incentive | | $ | 5,100,000 | (1) | | $ | 5,080,000 | (2) | | -0.39% | | | | | | | | $ 5,660,000 | (²) | | $ 5,200,000 | (³) | | -8.13% | | Long-Term Incentive(3) | | $ | 8,000,000 | | | $ | 8,000,000 | | | 0.00% | | | Total | | $ | 14,290,000 | | | $ | 14,270,000 | | | -0.14% | | | Charles F. Lowrey | | | | | | | | Base Salary | | $ | 770,000 | | | $ | 770,000 | | | 0.00% | | | Annual Incentive | | $ | 4,250,000 | (1) | | $ | 3,985,000 | (2) | | -6.24% | | | Long-Term Incentive(3) | | $ | 4,750,000 | | | $ | 5,000,000 | | | 5.26% | | | Long-Term Incentive(4) | | | | | | | | $ 8,000,000 | | | $ 8,000,000 | | | 0.00% | | Total | | $ | 9,770,000 | | | $ | 9,755,000 | | | -0.15% | | | | | | | | $14,850,000 | | | $14,390,000 | | | -3.10% | | Stephen Pelletier | | | | | | | | | | | | | | | | | Base Salary | | $ | 770,000 | | | $ | 770,000 | | | 0.00% | | | | | | | | $ 770,000 | | | $ 770,000 | | | 0.00% | | Annual Incentive | | $ | 3,200,000 | (1) | | $ | 3,985,000 | (2) | | 24.53% | | | | | | | | $ 4,700,000 | (²) | | $ 4,100,000 | (³) | | -12.77% | | Long-Term Incentive(3) | | $ | 4,500,000 | | | $ | 4,500,000 | | | 0.00% | | | Long-Term Incentive(4) | | | | | | | | $ 4,750,000 | | | $ 4,750,000 | | | 0.00% | | Total | | $ | 8,470,000 | | | $ | 9,255,000 | | | 9.27% | | | | | | | | $10,220,000 | | | $ 9,620,000 | | | -5.87% | | Scott G. Sleyster(5) | | | | | | | | | | | | Base Salary | | | | | | | | — | | | $ 700,000 | (¹) | | | — | | Annual Incentive | | | | | | | | — | | | $ 1,800,000 | (³) | | | — | | Long-Term Incentive(4) | | | | | | | | — | | | $ 3,800,000 | | | | — | | Total | | | | | | | | — | | | $ 6,300,000 | | | | — | |
| | (1) | Thirty percentSalary value represents the annualized salary for the new roles for Messrs. Lowrey, Tanji, Falzon and Sleyster. For Mr. Strangfeld, the value represents the annualized salary at the time of his retirement. | |
| (2) | 30% of this amount was mandatorily deferred into the Book Value Performance Program, which is part of the Long-Term Incentive Program. These amounts total $1,774,500$1,332,000 for Mr. Lowrey, $1,998,000 for Mr. Strangfeld, $780,000$999,000 for Mr. Falzon, $1,530,000$1,698,000 for Mr. Grier, $1,275,000and $1,410,000 for Mr. Lowrey, and $960,000 for Mr. Pelletier. | |
| | (2)(3) | Thirty percentFor Messrs. Lowrey, Strangfeld, Falzon, Grier and Pelletier, 30% of this amount was mandatorily deferred into the Book Value Performance Program, which is part of the Long-Term Incentive Program. For Messrs. Tanji and Sleyster, the deferral rate was 10%. These amounts total $1,792,800$1,230,000 for Mr. Lowrey, $1,839,600 for Mr. Strangfeld, $897,000$110,000 for Mr. Tanji, $921,000 for Mr. Falzon, $1,524,000$1,560,000 for Mr. Grier, $1,195,500$1,230,000 for Mr. Lowrey,Pelletier, and $1,195,500$180,000 for Mr. Pelletier.Sleyster. | |
| | (3)(4) | Represents the compensation value of long-term awards for each performance year. For example, the long-term values under the “2016“2018 Compensation” column represent awards made in February 20172019 for the 20162018 performance year, excluding amounts mandatorily deferred from the annual incentive awards. For Mr. Strangfeld, the value in the 2018 column represents the compensation value of long-term awards made in November 2018 for the 2018 performance year. | |
| | (4)(5) | Reflects annualized salary2017 Compensation and Percentage Change are not provided for Messrs. Tanji and Sleyster as of December 31, 2015. Effective February 22, 2016, Mr. Falzon received a salary increase of $70,000, resultingthey became NEOs initially in an annualized salary of $770,000.2018. | |
REPORTED CHANGES IN PENSION VALUES
As part of its compensation review, the Compensation Committee considered the dollar amount change in pension value for Mr. Strangfeld and the other NEOs. The change in the present value of Mr. Strangfeld’s pension for 2016 reflects a number of factors, including his 39 years of service, his age, his average earnings, changes in interest rates and life expectancy assumptions used to calculate the pension plan obligations. These factors, as well as our plan design that updates average earnings every other year, resulted in an increase in Mr. Strangfeld’s pension accrual for 2016. Pension values may fluctuate significantly from year to year and it is expected that in 2017, should interest rates remain unchanged, the change in Mr. Strangfeld’s pension accrual will be substantially lower. Alternatively, if the discount rate were to rise, it is possible that Mr. Strangfeld’s change in pension value in future years could be a negative amount, as it was for the years 2015 and 2013. Given this inherent volatility, the Compensation Committee will continue to monitor future accruals for Mr. Strangfeld and the other NEOs. The Traditional Pension Formula that applies to Mr. Strangfeld was closed to employees hired on or after January 1, 2001.
è
| | | | | | | | 66 | | | | | Notice of Annual Meeting of Shareholders and 20172019 Proxy Statement | | | | 57 | |
| | |
| | Supplemental Compensation Analysis | |
TOTAL SHAREHOLDER RETURN The chart below shows our absolute Total Shareholder Return (“TSR”) and percentile ranking relative to the 20 companies in our Peer Group over the three time periods indicated. | | | | | | | | | | | | | | | | Total Shareholder Return | | | | 1-Year | | | 3-Year | | | 5-Year | | | Cumulative TSR | | | 33% | | | | 24% | | | | 135% | | | Annualized TSR | | | 33% | | | | 7% | | | | 19% | | | Percentile Rank | | | 84% | | | | 49% | | | | 56% | |
| | | | | | | | | | | | | | | | Total Shareholder Return | | | | 1-Year | | | 3-Year | | | 5-Year | | Cumulative TSR | | | -26% | | | | 11% | | | | 3% | | Annualized TSR | | | -26% | | | | 3% | | | | 1% | | Percentile Rank | | | 28% | | | | 46% | | | | 23% | |
With respect to our three-year TSR, and to a lesser extent our five-year TSR,For most of this period, Prudential iswas the only life insurer among our
the Peer Group that iswas subject to Federalfederal regulation as anon-bank
systemically important financial institution (“SIFI”).
The discussion of our SIFI status and our subsequent designation began in 2012 with our designation occurring in 2013.institution. We believe this occurrence, as well as the questions on
uncertainty concerning the additional regulatory requirements that might accompany
accompanied this designation among other factors, may have negatively impacted our three-year and five-year TSR.
TSR over that period.
CEO REALIZED AND REALIZABLE PAY ANALYSIS The total compensation of our NEOs as reported in the 20162018 Summary Compensation Table is calculated in accordance with SEC rules. Under these rules, we are required to show the grant date fair value of equity and equity-based awards, even though the ability of our executive officers to realize value from such awards is contingent on the achievement of certain performance conditions (including, in the case of stock options, the sustained increase in our stock price). TheFor each of our executives serving as CEO during 2018, the accompanying chart compares our CEO’shis total compensation, as measured based on actual compensation received (or, with regard to pending awards, realizable pay based on the applicable performance elements and stock value at a relatively current time), to the amounts reported for him in the Summary Compensation Table for the periods shown. The chart illustrates that our executive compensation program is designed so that the amount of compensation that our CEO actually receives, or is expected to receive, may be higher or lower than the amount we are required to report in the Summary Compensation Table, depending on the performance of our Common Stock and our performance relative to our key financial objectives. It demonstrates the strong alignment of the interests of our executive officers with those of our shareholders. | | | | | | | | Notice of Annual Meeting of Shareholders and 2019 Proxy Statement | | | | | 67 |
| | |
| | Supplemental Compensation Analysis | |
CEO TOTAL COMPENSATION — Charles F. Lowrey Grant Date Fair Value vs. Realized and Realizable Gains (in thousands) | | | 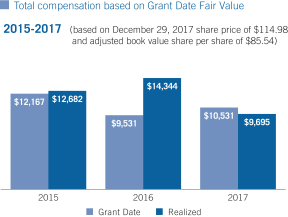 | | 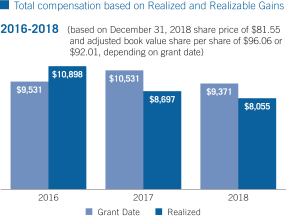 |
| | | | | 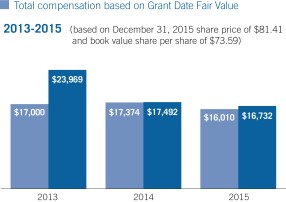 | | | | 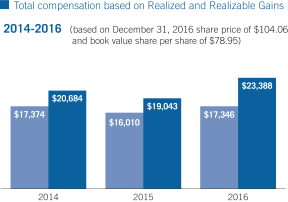 | • Total compensation based on grant date fair value is the sum of base salary; actual annual incentive payout for the performance year (excluding the portion mandatorily deferred into the long-term Book Value Performance Program); the grant date fair values of the performance shares and units, book value units and stock options awarded each year. • Total compensation based on realized and realizable pay is the sum of: base salary; actual annual incentive payout for the performance year (excluding the portion mandatorily deferred into the long-term Book Value Performance Program); performance shares and units awarded in 2015 and paid in February 2018 based on an earnout factor of 1.104 times target valued at the closing price on December 29, 2017 (the last trading day of 2017), $114.98; performance shares and units awarded in 2016 and 2017 valued at target based on the $114.98 share price; the actual book value units awarded each year but paid in three annual tranches including unpaid portions valued as of December 31, 2017 at $85.54 per unit; and the intrinsic value of stock options awarded in each year based on the $114.98 share price at year end. • For 2017, a key reason for the difference between grant date and realized/realizable pay is that the intrinsic value of the stock options at year-end is significantly less than the grant date fair value of the options. The primary reason for the difference between the grant date and realized value for years 2015 and 2016 is that the stock price at the end of 2017 was significantly higher than on the grant dates. | | | | • Total compensation based on grant date fair value is the sum of base salary; actual annual incentive payout for the performance year (excluding the portion mandatorily deferred into the long-term Book Value Performance Program); the grant date fair values of the performance shares and units, book value units and stock options awarded each year. • Total compensation based on realized and realizable pay is the sum of: base salary; actual annual incentive payout for the performance year (excluding the portion mandatorily deferred into the long-term Book Value Performance Program); performance | i
| | | | i
|
| | | | | 58 | | | Notice shares and units awarded in 2016 and paid in February 2019 based on an earnout factor of Annual Meeting1.142 times target valued at the closing price on December 31, 2018 (the last trading day of Shareholders and 2017 Proxy Statement |
| | | | | Supplemental Compensation Analysis
|
| | | | | 2018), $81.55; performance shares and units awarded in 20132017 and paid in February 2016 based on an earnout factor of 1.5 times target valued at the December 31, 2015 share price of $81.41; performance shares and units awarded in 2014 and 20152018 valued at target based on the $81.41$81.55 share price; the actual book value units awarded each year but paid in three annual tranches including unpaid portions valued as of December 31, 20152018 at $73.59$96.06 per unit;unit (awards granted prior to 2018 valued at $92.01); and the intrinsic value of stock options awarded in each year based on the $81.41$81.55 share price as of December 31, 2015.at year end. • For 2013,years 2017 and 2018, a key reason whyfor the difference between grant date and realized/realizable pay differ is that the intrinsic value of the stock options at year-end is significantly less than the grant date fair value of the options. The primary reason for the difference between the grant date and realized value for 2016 is that the stock price at the end of 2018 was higher than on the grant date. |
| | | | | | | | 68 | | | | | Notice of Annual Meeting of Shareholders and 2019 Proxy Statement |
| | |
| | Supplemental Compensation Analysis | |
CEO TOTAL COMPENSATION — John R. Strangfeld Grant Date Fair Value vs. Realized and Realizable Gains (in thousands) | | | 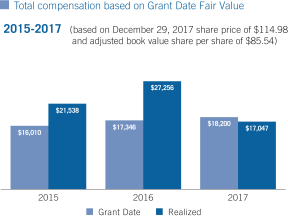 | | 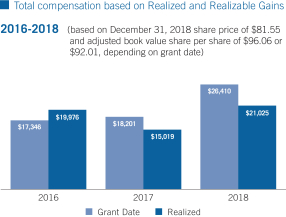 |
| | | | | • Total compensation based on grant date fair value is the sum of base salary; actual annual incentive payout for the performance year (excluding the portion mandatorily deferred into the long-term Book Value Performance Program); the grant date fair values of the performance shares and units, book value units and stock options awarded in each year are significantly higher when valued as of December 31, 2015. Another contributing factor to the higher realized/year. • Total compensation based on realized and realizable pay is the sum of: base salary; actual annual incentive payout for 2013 is that the 2013 performance shares program payment is 1.5 times target reflectingyear (excluding the achievement of our sustainable ROE objective of 13% to 14%. There is little difference betweenportion mandatorily deferred into the grant date and realized/realizable pay amounts in either 2014 or 2015, consistent with the relatively small change in our share price over that period. | | | | shares and units awarded in 2014 and paid in February 2017 based on an earnout factor of 1.25 times target valued at the December 31, 2016 share price of $104.06;long-term Book Value Performance Program); performance shares and units awarded in 2015 and paid in February 2018 based on an earnout factor of 1.104 times target valued at the closing price on December 29, 2017 (the last trading day of 2017), $114.98; performance shares and units awarded in 2016 and 2017 valued at target based on the $104.06$114.98 share price; the actual book value units awarded each year but paid in three annual tranches including unpaid portions valued as of December 31, 20162017 at $78.95$85.54 per unit; and the intrinsic value of stock options awarded in each year based on the $104.06$114.98 share price as of December 31, 2016.at year end.
• For 2016,2017, a key reason whyfor the difference between grant date and realized/realizable pay differ is that the intrinsic value of the stock options andat year-end is significantly less than the grant date fair value of the performance shares and units awarded are significantly higher when valued as of December 31, 2016.options. The primary reason for the difference between the grant date and realized value for years 20142015 and 20152016 is that the grant date stock price at the end of 2017 was significantly higher than on the grant dates. | | | | • Total compensation based on grant date fair value is the sum of base salary; actual annual incentive payout for the performance year (excluding the portion mandatorily deferred into the long-term Book Value Performance Program); the grant date fair values of the performance shares and units, book value units and stock options awarded each year. • Total compensation based on realized and realizable pay is the sum of: base salary; actual annual incentive payout for the performance year (excluding the portion mandatorily deferred into the long-term Book Value Performance Program); performance shares and units awarded in 20142016 and 2015paid in February 2019 based on an earnout factor of 1.142 times target valued at the closing price on December 31, 2018 (the last trading day of 2018), $81.55; performance shares and units awarded in 2017 and 2018 valued at target based on the $81.55 share price; the actual book value units awarded each year but paid in three annual tranches including unpaid portions valued as of December 31, 2018 at $96.06 per unit (awards granted prior to 2018 valued at $92.01); and the intrinsic value of stock options awarded in each year based on the $81.55 share price at year end. • For years 2017 and 2018, a key reason for the difference between grant date and realized/realizable pay is that the intrinsic value of the stock options at year-end is significantly less than itthe grant date fair value of the options. The primary reason for the difference between the grant date and realized value for 2016 is that the stock price at the end of 2018 was in 2016.higher than on the grant date. |
WHY WE USE ADJUSTED OPERATING INCOME (“AOI”) INSTEAD OF GAAP NET INCOME(1)
Why don’t we use GAAP net income as our compensation performance measure?
We seek to compensate our senior executive officers based on their success in building shareholder value through the operation of the Company’s businesses. The Committee and the investment community do not believe GAAP net income optimally measures the creation of shareholder value because it may be significantly affected by items with limited economic impact, or that are otherwise not indicative of ongoing trends.
Why do we use AOI as our compensation performance measure?
The Committee believes AOI is superior to GAAP net income as a measure of our performance because AOI includes only our results of operations from ongoing operations and the related underlying profitability factors, and excludes items that are not indicative of ongoing trends. Among other things, AOI excludes items where the timing of the impact is subject to management discretion, items with limited economic impact, items that we expect to reverse over time, and items that are otherwise not indicative of our ongoing performance.
What are some examples of items included in GAAP net income, but excluded from AOI, and why are they excluded?
Realized investment gains/losses. Sales of general account invested assets may result in a gain or loss that is recognized in GAAP net income. However, the timing of these sales that would result in gains or losses (such as gains or losses related to changes in interest rates) is largely subject to our discretion and influenced by market opportunities as well as our tax and capital profile. Accordingly, we believe gains or losses on these sales are not indicative of business performance trends.
Foreign currency exchange rate liability remeasurement. GAAP requires us to recognize on our income statement gains and losses on certain insurance liabilities due to changes in foreign currency exchange rates. However, these liabilities are supported by assets for which corresponding changes in value due to changes in foreign exchange rates are recognized in
| accumulated othercomprehensive income (loss) on our balance sheet under GAAP. Given that the gains and losses on the income statement for these insurance liabilities are offset by changes to accumulated other comprehensive income (loss) on our balance sheet, the impact on the Company isnon-economic and therefore not a reflection of shareholder value created or lost. The Company has taken steps to mitigate the impact of foreign currency exchange rate liability remeasurement on GAAP net income or loss, commencing in 2015.
|
| • | | Divested businesses. The contribution to GAAP net income or loss of divested businesses that have been or will be sold or exited or are in wind-down status are excluded from AOI since the results of divested businesses are not relevant to an understanding of the Company’s ongoing operations. | |
| (1) | For more information, see Appendix A to this Proxy Statement. |
| | | | | | | | Notice of Annual Meeting of Shareholders and 20172019 Proxy Statement | | | | 59| | | 69 |
| | |
| | Compensation Discussion and Analysis | |
Post-Employment Compensation Retirement Plans We view retirement benefits as a key component of our executive compensation program because they encourage long-term service. Accordingly, we offer our employees, including the NEOs, a comprehensive benefits program that provides the opportunity to accumulate adequate retirement income. This program includes both defined benefit and defined contribution plans, as well as two supplemental retirement plans which allow highly compensated employees (that is, employees whose compensation exceeds the limits established by the Internal Revenue Code for covered compensation and benefit levels) to receive the same benefits they would have earned but for these limitations. Further, we sponsor three supplemental executive retirement plans (“SERPs”) for certain eligible executive officers, including the NEOs, to offset the potential loss or forfeiture of retirement benefits under certain limited circumstances or to provide additional benefits to certain key executives. For descriptions of these plans, including their titles, see “Pension Benefits.” We also maintain the Prudential Insurance Company of America Deferred Compensation Plan (the “Deferred Compensation Plan”). We offer this plan to our executive officers, including the NEOs, as a competitive practice. For a description of this plan, see “Nonqualified Deferred Compensation.” Periodically, we compare the competitiveness of our benefits programs for our employees, including retirement benefits, against other employers with whom we broadly compete for talent. It is our objective to provide our employees with a benefits package that is at or around the median of the competitive market when compared to other employers. Severance and Change in Control Arrangements Our Board has adopted a policy prohibiting us from entering into any severance or change in control agreement with any of our executive officers, including the NEOs, that provides for payments and benefits that exceed 2.99 times the sum of the executive officer’s base salary and most recently earned cash bonus, without shareholder approval or ratification. We do not provide excise tax payments, reimbursements, or“gross-ups” to any of our executive officers. While our other executive officers are eligible for severance payments in the event of an involuntary termination of employment without “cause,” neither our former CEO nor our current CEO is not a participant in the severance program (discussed below) providing this benefit. To enable us to offer competitive total compensation packages to our executive officers, as well as to ensurepromote the ongoing retention of these individuals when considering potential transactions that may create uncertainty as to their future employment with us, we offer certain post-employment payments and benefits to our executive officers, including the NEOs, upon the occurrence of several specified events. These payments and benefits are provided under two separate programs: the Prudential Severance Plan for Senior Executives (the “Severance Plan”); and the Prudential Financial Executive Change in Control Severance Program. We have not entered into individual employment agreements with our executive officers.NEOs. Instead, the rights of our executive officersNEOs with respect to post-employment compensation upon specific events, including death, disability, severance or retirement, or a change in control of the Company, are covered by these two programs. We use plans, rather than individually negotiated agreements, to provide severance and change in control payments and benefits for several reasons. First, a “plan” approach provides us with the flexibility to change the terms of these arrangements from time to time. An employment agreement would require that the affected executive officerNEO consent to any changes. Second, this approach is more transparent, both internally and externally. Internal transparency eliminates the need to negotiate severance or other employment separation payments and benefits on acase-by-case basis. In addition, it assures each of our executive officersNEOs that his or herthe severance payments and benefits he receives are comparable to those of other executive officers with similar levels of responsibility and tenure.one another. As previously noted, our executive officers, including the NEOs, except for our CEO, are eligible for severance payments and benefits in the event of an involuntary termination of employment without “cause.” These executive officers and our CEO are also eligible for “double trigger” severance payments and benefits in the event of an involuntary termination of employment without “cause” or a termination of employment with “good reason” in connection with a change in control of the Company. Our equity awards are also designed to be “double trigger,” so long as such awards are allowed to continue in effect following any change in control transaction on substantially equivalent terms and conditions to those applicable prior to such transaction. | | | | | 60 | | | 70 | | | | | Notice of Annual Meeting of Shareholders and 20172019 Proxy Statement |
| | |
| | Compensation Discussion and Analysis | |
The payment of these awards at target achievement rewards the executive officer for his or her expected performance prior to the change in control transaction. For detailed information on the estimated potential payments and benefits payable to the NEOs in the event of their termination of employment, including following a change in control of the Company, see “Potential Payments Upon Termination or Change in Control.” Perquisites and Other Personal Benefits We generally do not provide our executive officers, including the NEOs, with perquisites or other personal benefits, except for the use of Company aircraft, Company-provided vehiclescars and drivers, executive physicals and, in the case of our CEO and Vice Chairman, security services. These items are provided because we believe that they serve a necessary business purpose and represent an immaterial element of our executive compensation program. The cost allocated to the personal use of Company-provided vehiclescars and drivers, including commuting expenses, the cost of the executive physicals, and the incremental cost associated with the security services, to the extent not reimbursed to us, are reported in the Summary Compensation Table. Our executive officers, including the NEOs, are required to reimburse us for the incremental cost of any personal use of Company aircraft. We do not provide tax reimbursements or any other tax payments with respect to perquisites, including excise tax“gross-ups”,gross-ups,” to any of our executive officers. Perquisites and other personal benefits represent an immaterial element of our executive compensation program. Other Compensation Related Policies In addition to the other components of our executive compensation program, we maintain the policies described below. These policies are consistent with evolving best practices and help ensureconfirm that our executive compensation program does not encourage our executive officers to engage in behaviors that are beyond our ability to effectively identify and manage risk. Clawback Policy In 2015, we strengthened our clawback policy to cover all incentive compensation and to address material financial restatements and improper conduct (including failure to report).
The revisedOur clawback policy covers all executive officers (including the NEOs) and, applies to all incentive-based compensation (including stock options and other equity awards) paid to or in respect of an executive officer.officer, and includes separate triggers for material financial restatements and improper conduct (including failure to report). The policy provides that if (i) the Company is required to undertake a material restatement of any financial statements filed with the SEC or (ii) an executive officer engages in improper conduct that either has had, or could reasonably be expected to have, a significant adverse reputational or economic impact on the Company or any of its affiliates or divisions, then the Board may, in its sole discretion, after evaluating the associated costs and benefits, seek to recover all or any portion of the incentive-based compensation paid to any such executive officer during the three-year period preceding the restatement, or the occurrence of the improper conduct, as the case may be.
The policy also requires us to disclose to our shareholders, not later than the filing of the next proxy statement, the action taken by the Board, or the Board’s decision not to take action, with regard to compensation recovery following the occurrence of a material restatement or improper conduct, so long as such event has been previously disclosed in our SEC filings. For purposes of the policy, a “restatement” means any material restatement (occurring after the effective date of thisthe policy) of any of the Company’s financial statements that have been filed with the SEC under the Exchange Act or the Securities Act of 1933, as amended. “Improper conduct” means willful misconduct (including, but not limited to, fraud, bribery or other illegal acts) or gross negligence, which, in either case, includes any failure to report properly, or to take appropriate remedial action with respect to, such misconduct or gross negligence by another person. Other Long-Term Compensation Recovery Policies In 2015, we adoptedWe maintain a “resignation notice period” requirement as part of the terms and conditions of all long-term incentive awards granted to certain designated grades of executives, including the NEOs. The requirement is applicable to awards granted
| | | | | | | Notice of Annual Meeting of Shareholders and 2017 Proxy Statement | | | | 61 | |
| | | | | Compensation Discussion and Analysis
|
in 2015 and subsequent years. The requirement is intended to reduce the adverse and disruptive effect of a sudden voluntary departure | | | | | | | | Notice of Annual Meeting of Shareholders and 2019 Proxy Statement | | | | | 71 |
| | |
| | Compensation Discussion and Analysis | |
of an executive subject to the requirement, and requires him or her to provide notice for a specified period prior to the effective date of a voluntary resignation, or otherwise risk forfeiting his or her outstanding long-term incentive awards. The terms and conditions of long-term incentive awards also provide for forfeiture in the event a recipient violates applicablenon-solicitation ornon-competition agreements. Process for Approving Long-Term Incentive Awards The Committee approves long-term incentive awards (including stock options, book value units, performance shares, performance units and restricted stock units) on an annual basis at its regularly scheduled February meeting. The Committee has delegated authority to management to approve long-term incentive awards for new hires, promotions, and retention purposes within specified limits to employees below the level of senior vice president. The Committee approves any long-term incentive awards to newly hired or promoted senior executives. From time to time, the Committee may make special long-term incentive awards to recognize major milestones or in situations involving a leadership transition. For example, in November 2018, the Committee granted a long-term incentive award to Mr. Strangfeld upon his retirement as CEO in respect of the 2018 performance year. Under the terms of our 2016 Omnibus Plan, which was approved by shareholders in 2016, stock options are required to be priced at the fair market value of our Common Stock on the date of grant, which is based on the closing market price of our Common Stock on the date of grant. TheBeginning in February 2019, the number of shares of our Common Stock subject to a stock option grant to an individual is determined by dividing the compensation value of the grant by the fair value of each stock option based on the average closing market price of our Common Stock on the NYSE for the final20-day trading period in the month prior toon the grant date. The Beginning in February 2019, the number of performance shares and units or restricted stock units awarded to an individual is determined by a formula that divides the compensation value of the award by the closing market price of our Common Stock on the NYSE on the grant date. Previously, the fair value of stock options and the number of performance shares and units and restricted stock units awarded was based on the average closing market price of our Common Stock on the NYSE for the final20-day trading period in the month prior to the grant date.
Stock Ownership Guidelines We have adopted stock ownership guidelines for our executive officers to encourage them to build their ownership position in our Common Stock over time by direct market purchases, making investments available through the PESP and the Deferred Compensation Plan, and retaining shares they earn under their long-term incentive awards. In 2015, we revised the guidelines to increase the CEO stock ownership level from 500% to 700% of base salary. The guidelines are framed in terms of stock value as a percentage of base salary as follows: | | | | | | Position | | Stock Value as a Percentage of Base Salary | | Chief Executive Officer | | | 700% | | Vice Chairman and Executive Vice PresidentsPresident | | | 300% | | Senior Vice PresidentsPresident | | | 200% | |
Each of the NEOs meets his individual stock ownership level. Underlevel, with the exception of Messrs. Lowrey and Tanji due to their promotions as of December 1, 2018.Under the current stock ownership guidelines, once an executive officer attains his or her individual ownership level, he or she will remain in compliance with the guidelines despite future changes in our stock price and base salary, as long as his or her holdings do not decline below the number of shares at the time the stock ownership guidelines were met. Stock Retention Requirements We have adopted stock retention requirements for our executive officers. Each executive officer is required to retain 50% of the net shares (after payment of the applicable exercise price (if any), fees, and taxes) acquired upon the exercise of stock options or the payment or vesting of any performance shares and restricted stock units. The executive officer is required to hold such shares until the later of one year following the date of acquisition of such shares (even if thisone-year holding period extends beyond termination of employment) or the date that he or she satisfies our stock ownership guidelines. | | | | | | | | 72 | | | | | Notice of Annual Meeting of Shareholders and 2019 Proxy Statement |
| | |
| | Compensation Discussion and Analysis | |
Prohibition of Derivatives Trading, and Hedging and Pledging of Our Securities Our Board has adopted a policy prohibiting all employees, including the NEOs, and members of the Board from engaging in any hedging transactions with respect to any of our equity securities held by them, which includes the purchase of any financial instrument (including prepaid variable forward contracts, equity swaps, collars, and exchange funds) designed to hedge or offset any decrease in the market value of such equity securities. | | | | | 62 | | | Notice of Annual Meeting of Shareholders and 2017 Proxy Statement |
| | | | | Compensation Discussion and Analysis
|
Our Board has also adopted a policy prohibiting our Section 16 officers and members of the Board from pledging, or using as collateral, our securities to secure personal loans or other obligations, which includes holding shares of our Common Stock in a margin account. POLICY ON RULE10b5-1 TRADING PLANS We have a policy governing the use by executive officers ofpre-established trading plans for sales of our Common Stock and exercises of stock options for shares of our Common Stock. We believe our Rule10b5-1 policy reflects best practicespractice and is effective in ensuring compliancecomplying with legal requirements. Under the policy: | | • | | All Rule10b5-1 trading plans must bepre-cleared by our law and compliance.compliance departments. | |
| | • | | A trading plan may be entered into, modified or terminated only during an open trading window and while not in possession of materialnon-public information. | |
| | • | | No trade may occur for the first 30 days after the trading plan is established. No modification or termination of a plan may affect any trade scheduled to occur within 30 days. | |
DEDUCTIBILITY OF EXECUTIVE COMPENSATION It is our policy to structure and administer our annual and long-term incentive compensation plans and stock option grants for our CEO and the other NEOs to maximize the tax deductibilitySection 162(m) of the payments as “performance-based compensation”Internal Revenue Code limits a publicly held corporation’s ability to take a tax deduction for purposescompensation paid to certain executive officers (“covered employees”) in excess of Section 162(m)$1 million. Prior to the extent practicable. In 2016, all such2018, certain performance-based compensation was deductible. The Committee may provideexempt from the $1 million deduction limit. This performance-based exception was repealed for taxable years beginning after December 31, 2017, such that compensation thatpaid to covered employees in excess of $1 million after 2017 is not tax deductible, ifunless it determines that such action is appropriate andqualifies for transition relief applicable to certain arrangements in place as of November 2, 2017. The Company intends to avail itself of this transition relief, to the best interests of the Company. Further, the rules and regulations promulgated under Section 162(m) are complicated, and may change from time to time, sometimes with retroactive effect. As such, there can be no guarantee that any compensation intended to qualify as “performance-based compensation” will so qualify.
The 2016 Omnibus Plan contains an overall limit onextent applicable, for compensation paid pursuant to covered executiveswritten, binding contracts that were in effect on November 2, 2017. Notwithstanding changes to comply with the conditions for determining “performance-based compensation” undertax deductibility requirements of Section 162(m). Under, the termsCommittee continues to believe that a significant portion of the 2016 Omnibus Plan, payment on annual incentive awardsour executive officers’ compensation should be tied to an NEO who is subject to Section 162(m) in a taxable year may not exceed 0.4%measures of ourpre-tax AOI for the year ended prior to the year in which payment is due. Awardsperformance of restricted stock units, performance shares, performance units and book value units and associated dividend equivalents have a performance condition that ourpre-tax AOI must be positive in at least one fiscal year during which the award is outstanding for at least 276 days of that year, and a maximum limitation that the amount payable in any year may not exceed 0.4% of the highest amount of ourpre-tax AOI for any of the three years ended prior to the year payment on those awards is due. For awards granted prior to May 2016 under the Omnibus Incentive Plan, the total payout on awards of annual incentives, restricted stock units, performance shares, performance units and book value units and associated dividend equivalents for an NEO who is subject to Section 162(m) in a taxable year cannot exceed 0.6% ofpre-tax AOI for the prior year. businesses.
COMPENSATION COMMITTEE REPORT The Compensation Committee of our Board of Directors has reviewed and discussed with management the Compensation Discussion and Analysis contained in this Proxy Statement. Based on its review and these discussions, the Compensation Committee has recommended to our Board of Directors that the Compensation Discussion and Analysis be included in this Proxy Statement and incorporated by reference into our Annual Report on Form10-K for the year endedDecember 31, 2016.2018. THE COMPENSATION COMMITTEE Karl J. Krapek Chair(Chair) Thomas J. Baltimore Michael A. Todman | | | | | | | | Notice of Annual Meeting of Shareholders and 20172019 Proxy Statement | | | | 63| | | 73 |
2018 CEO Pay Ratio In accordance with SEC rules, for 2018, we determined the annual total compensation of our median compensated employee and present a comparison of that annual total compensation to the annual total compensation of our CEO. | • | | The 2018 annual total compensation of our CEO was $26,634,837. This reflects a combination of the total compensation of Messrs. Lowrey and Strangfeld for the period they each served as CEO in 2018. | |
| • | | The 2018 annual total compensation of our median compensated employee was $104,092. | |
| • | | Accordingly, the ratio of our CEO’s annual total compensation to the annual total compensation of our median compensated employee for 2018 was 256 to 1*. | |
*This ratio is a reasonable estimate calculated in a manner consistent with Item 402(u) of the SEC’s RegulationS-K. Calculating the 2018 CEO Pay Ratio | | | | | | | | | Determining the Median Compensated Employee | | Jurisdictions Excluded from Employee Population (number of employees estimated as of October 1, 2017) | To calculate the 2018 CEO pay ratio, we used the same median compensated employee that we used for purposes of calculating the 2017 CEO pay ratio, as there has been no change in our employee population or employee compensation arrangements that we believe would significantly impact the CEO pay ratio. As described more completely in our 2018 Proxy Statement, to determine this median compensated employee: • We collected compensation data for all employees as of October 1, 2017, excluding employees in countries that, in the aggregate, comprise less than 5% of our global employee population (considered“de minimis” under SEC rules). We also excluded from this population independent contractors and other individuals classified asnon-employees in their respective jurisdictions based on our employment and payroll tax records; • We included data for employees in the following six countries, comprising 95.6% of our global employee population: the United States, Japan, Ireland, Taiwan, Brazil, and Korea. This excludes approximately 2,000 employees from 14 jurisdictions, as shown in the table on the right. As of October 1, 2017, Prudential had an aggregate of 44,857 employees, of which 18,311 were U.S. employees and 26,546 were non-U.S. employees. This total excludes independent contractors and other individuals classified as non-employees, such as certain sales associates. | | | | Country | | Employees (Estimate) | | | | | | Poland | | 406 | | | | | | Malaysia | | 381 | | | | | | Argentina | | 357 | | | | | | Italy | | 330 | | | | | | United Kingdom | | 188 | | | | | | Mexico | | 139 | | | | | | Singapore | | 72 | | | | | | Germany | | 58 | | | | | | Luxembourg | | 13 | | | | | | France | | 10 | | | | | | Australia | | 7 | | | | | | Hong Kong | | 5 | | | | | | China | | 2 | | | | | | India | | 2 | | | | | | | | | | | | | | | | | | | | | | | | | | | | | | | | | | | | | | | | | | | | | | | | | | | | | | | | | | | | | | | | | | |
| • | | We used “Total Cash Pay” as our compensation measure, which, for these purposes, included base salary, short-term incentive payments (e.g., payments under our Annual Incentive Program), cash commissions and other similar payments. We annualized Total Cash Pay for permanent employees hired during the period and did not make anycost-of-living adjustments. |
Our “median compensated employee” is an individual who earned Total Cash Pay at the midpoint, that is, the point at which half of the global employee population earned more Total Cash Pay and half of the global employee population earned less Total Cash Pay. | | | | | | | | 74 | | | | | Notice of Annual Meeting of Shareholders and 2019 Proxy Statement |
| | |
| | 2018 CEO Pay Ratio | |
Determining 2018 Annual Total Compensation We determined 2018 annual total compensation for our median compensated employee by obtaining compensation data for this employee for 2018 consistent with the methodology we use to calculate total compensation for 2018 as it appears in the 2018 Summary Compensation Table. Accordingly, it includes base salary earned and paid from January 1, 2018 through December 31, 2018,non-equity incentive plan payments made for the performance period January 1, 2018 through December 31, 2018, equity incentives and options awards granted during the fiscal year, and other compensation earned and/or paid in 2018, such as Company contributions to retirement savings plans. In addition, for purposes of calculating the CEO pay ratio, SEC rules permit us to include in annual total compensation any compensation and benefits made available to employees broadly, such as medical and dental benefits. We elected to include amounts representing employer medical and dental contributions in determining the 2018 annual total compensation of our median employee. Messrs. Lowrey and Strangfeld each served as CEO in 2018. For purposes of the 2018 CEO pay ratio, we calculated our CEO’s annual total compensation for 2018 by adding Mr. Strangfeld’s annual total compensation as reflected in the 2018 Summary Compensation Table (but excluding the amount he received for service as a non-employee Director in December 2018) to Mr. Lowrey’s salary as CEO starting December 1, 2018. We also included an amount representing their pro-rata portions of employer medical and dental contributions. The SEC rules for identifying the median employee and calculating the pay ratio allow companies to apply various methodologies and apply various assumptions and, as a result, the pay ratio reported by us may not be comparable to the pay ratio reported by other companies. | | | | | | | | Notice of Annual Meeting of Shareholders and 2019 Proxy Statement | | | | | 75 |
Executive Compensation 20162018 Summary Compensation Table
The following table presents, for the years ended December 31, 2016, 2015,2018, 2017, and 2014,2016, the compensation of Mr.Messrs. Lowrey and Strangfeld, who each served as our principal executive officer Mr.in 2018, Messrs. Tanji and Falzon, who each served as our principal financial officer in 2018, and Messrs. Grier, LowreyPelletier and Pelletier,Sleyster, our three most highly compensated executive officers (other than the principal executive officer and principal financial officer) who were serving as executive officers as of December 31, 2016.2018. For information on the role of each compensation component within the total compensation packages of the NEOs, please see the relevant description in the “Compensation Discussion and Analysis (“CD&A”).” The compensation data in this table is presented in accordance with the SEC disclosure rules. For the Compensation Committee’s view of 20162018 performance year compensation, see the “Supplemental Compensation Analysis — Total Direct Compensation” in the CD&A. 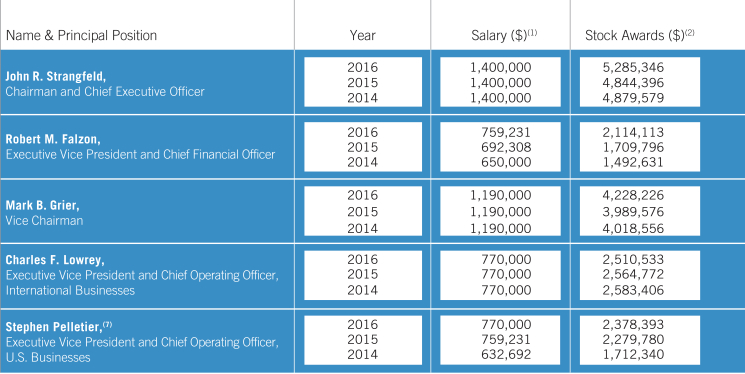 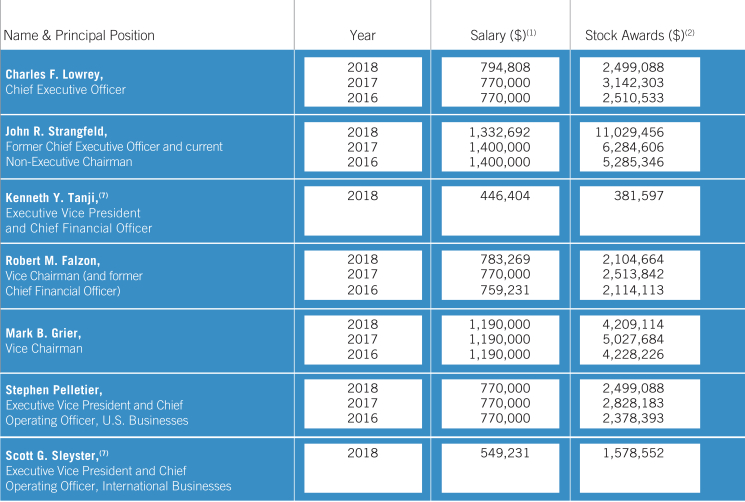 Name & Principal Position Year Salary ($)(1) Bonus ($) Charles F. Lowrey, 2018 794,808 - Chief Executive Officer 2017 770,000 - 2016 770,000 - John R. Strangfeld, 2018 1,332,692 - Chairman and Former 2017 1,400,000 - Chief Executive Officer 2016 1,400,000 - Ken Tanji 2018 446,404 - Executive Vice President and Chief Financial Officer Robert M. Falzon, 2018 783,269 - Vice Chairman and Former 2017 770,000 - Chief Financial Officer 2016 759,231 - Mark B. Grier, 2018 1,190,000 - Vice Chairman 2017 1,190,000 - 2016 1,190,000 - Stephen Pelletier,(8) 2018 770,000 - Executive Vice 2017 770,000 - President and Chief 2016 770,000 - Operating Officer, U.S. Scott Sleyster 2018 549,231 - Executive Vice President and Chief Operating Officer, International Businesses Name & Principal Position Year Salary ($) (1) Stock Awards ($) (2) 2018 794,808 2,499,088 Charles F. Lowrey, 2017 770,000 3,142,303 Chief Executive Officer 2016 770,000 2,510,533 John R. Strangfeld, 2018 1,332,692 11,029,456 Former Chief Executive Officer and current 2017 1,400,000 6,284,606 non-executive Chairman 2016 1,400,000 5,285,346 Kenneth Y. Tanji,(7) 2018 446,404 381,597 Executive Vice President and Chief Financial Officer Robert M. Falzon, 2018 783,269 2,104,664 Vice Chairman (and former 2017 770,000 2,513,842 Chief Financial Officer) 2016 759,231 2,114,113 Mark B. Grier, 2018 1,190,000 4,209,114 Vice Chairman 2017 1,190,000 5,027,684 2016 1,190,000 4,228,226 Stephen Pelletier, 2018 770,000 2,499,088 Executive Vice President and Chief 2017 770,000 2,828,183 Operating Officer, U.S. Businesses 2016 770,000 2,378,393 Scott G. Sleyster,(7) 2018 549,231 1,578,552 Executive Vice President and Chief Operating Officer, International Businesses Non-Equity Incentive Change in Pension All Other Option Awards ($) (3) Plan Compensation ($)(4) Value ($)(5) Compensation ($)(6) Total ($) 854,897 5,478,255 661,825 68,585 10,357,459 1,030,568 5,915,828 889,770 50,853 11,799,322 885,869 5,805,597 811,276 48,130 10,831,405 3,756,846 8,789,157 1,217,090 525,561 26,650,802 2,061,108 9,273,376 7,972,080 120,229 27,111,399 1,864,985 8,947,438 6,844,507 101,979 24,444,255 63,568 1,111,611 59,264 19,024 2,081,468 701,436 4,120,282 333,217 48,988 8,091,856 824,460 4,259,475 731,136 50,158 9,149,071 746,006 3,794,452 534,157 45,420 7,993,379 1,402,872 7,354,361 940,560 82,751 15,179,658 1,648,892 7,778,282 1,839,665 76,967 17,561,490 1,491,997 7,506,580 1,467,470 80,641 15,964,914 832,968 5,315,371 9,015,161 71,250 18,503,838 927,500 5,793,200 5,585,850 68,726 15,973,459 839,253 4,655,628 4,931,849 64,298 13,639,421 263,038 2,308,958 125,875 23,287 4,848,942 Name & Principal Position Year Salary ($)(1) Bonus ($) Charles F. Lowrey, 2018 794,808 - Chief Executive Officer 2017 770,000 - 2016 770,000 - John R. Strangfeld, 2018 1,332,692 - Chairman and Former 2017 1,400,000 - Chief Executive Officer 2016 1,400,000 - Ken Tanji 2018 446,404 - Executive Vice President and Chief Financial Officer Robert M. Falzon, 2018 783,269 - Vice Chairman and Former 2017 770,000 - Chief Financial Officer 2016 759,231 - Mark B. Grier, 2018 1,190,000 - Vice Chairman 2017 1,190,000 - 2016 1,190,000 - Stephen Pelletier,(8) 2018 770,000 - Executive Vice 2017 770,000 - President and Chief 2016 770,000 - Operating Officer, U.S. Scott Sleyster 2018 549,231 - Executive Vice President and Chief Operating Officer, International Businesses Name & Principal Position Year Salary ($) (1) Stock Awards ($) (2) 2018 794,808 2,499,088 Charles F. Lowrey, 2017 770,000 3,142,303 Chief Executive Officer 2016 770,000 2,510,533 John R. Strangfeld, 2018 1,332,692 11,029,456 Former Chief Executive Officer and current 2017 1,400,000 6,284,606 non-executive Chairman 2016 1,400,000 5,285,346 Kenneth Y. Tanji,(7) 2018 446,404 381,597 Executive Vice President and Chief Financial Officer Robert M. Falzon, 2018 783,269 2,104,664 Vice Chairman (and former 2017 770,000 2,513,842 Chief Financial Officer) 2016 759,231 2,114,113 Mark B. Grier, 2018 1,190,000 4,209,114 Vice Chairman 2017 1,190,000 5,027,684 2016 1,190,000 4,228,226 Stephen Pelletier, 2018 770,000 2,499,088 Executive Vice President and Chief 2017 770,000 2,828,183 Operating Officer, U.S. Businesses 2016 770,000 2,378,393 Scott G. Sleyster,(7) 2018 549,231 1,578,552 Executive Vice President and Chief Operating Officer, International Businesses Non-Equity Incentive Change in Pension All Other Option Awards ($) (3) Plan Compensation ($)(4) Value ($)(5) Compensation ($)(6) Total ($) 854,897 5,478,255 661,825 68,585 10,357,459 1,030,568 5,915,828 889,770 50,853 11,799,322 885,869 5,805,597 811,276 48,130 10,831,405 3,756,846 8,789,157 1,217,090 525,561 26,650,802 2,061,108 9,273,376 7,972,080 120,229 27,111,399 1,864,985 8,947,438 6,844,507 101,979 24,444,255 63,568 1,111,611 59,264 19,024 2,081,468 701,436 4,120,282 333,217 48,988 8,091,856 824,460 4,259,475 731,136 50,158 9,149,071 746,006 3,794,452 534,157 45,420 7,993,379 1,402,872 7,354,361 940,560 82,751 15,179,658 1,648,892 7,778,282 1,839,665 76,967 17,561,490 1,491,997 7,506,580 1,467,470 80,641 15,964,914 832,968 5,315,371 9,015,161 71,250 18,503,838 927,500 5,793,200 5,585,850 68,726 15,973,459 839,253 4,655,628 4,931,849 64,298 13,639,421 263,038 2,308,958 125,875 23,287 4,848,942
| (1) | The amounts reported in theSalary column for 20162018 include elective contributions of a portion of their base salary to the SESP by Messrs. Lowrey, Strangfeld, Tanji, Falzon, Grier, Lowrey,Pelletier, and PelletierSleyster in the amounts of $45,400, $19,769, $37,000, $20,200,$20,792, $42,308, $6,856, $20,331, $36,600, $19,800, and $20,200,$10,969, respectively. |
| (2) | The amounts reported in theStock Awards column represent the aggregate grant date fair value for performance shares and performance units at target in each respective year. The maximum number of performance shares and performance units payable for 2018 is 1.375 times the target amounts. For awards granted in 2017 and 2016 2015,the maximum number of performance shares and 2014 areperformance units payable is 1.25 times the target amounts. |
| For awards granted in February 2018, the maximum performance shares and units payable and valued at the grant date price of $106.89 to Messrs. Lowrey, Strangfeld, Tanji, Falzon, Grier, Pelletier, and Sleyster are 32,148 or $3,436,300; 67,682 or $7,234,529; 4,910 or $524,830; 27,074 or $2,893,940; 54,146 or $5,787,666; 32,148 or $3,436,300; and 20,306 or $2,170,508, respectively. For Mr. Strangfeld, additional awards were made in November 2018 to recognize 2018 performance. For awards made in November 2018, the maximum performance shares and units payable and valued at the grant date price of $93.76 to Mr.Strangfeld is 84,590 or $7,931,158. |
| | | | | | | | 76 | | | | | Notice of Annual Meeting of Shareholders and 2019 Proxy Statement |
| | |
| | Executive Compensation | |
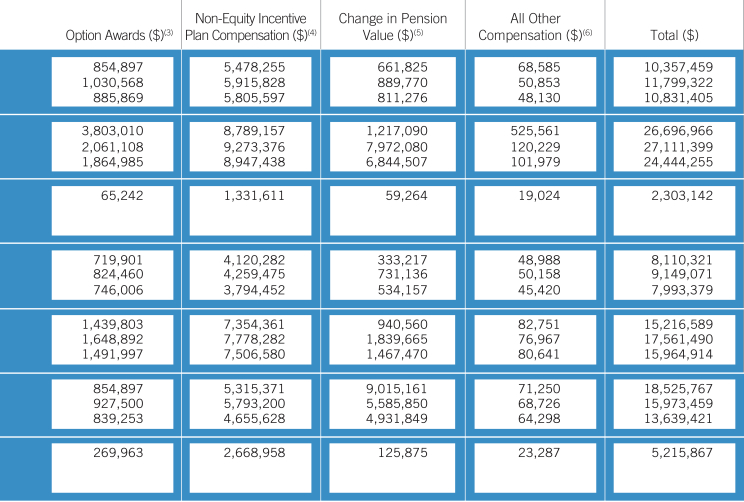
| For 2017, the maximum performance shares and units payable and valued at the grant date price of $110.45 to Messrs. Lowrey, Strangfeld, Falzon, Grier, and Pelletier are 35,564 or $3,928,044; 71,126 or $7,855,867; 28,450 or $3,142,303; 56,900 or $6,284,605; and 32,008 or $3,535,284, respectively. |
| For 2016, the maximum performance shares and units payable and valued at the grant date price of $63.59 to Messrs. Lowrey, Strangfeld, Falzon, Grier, Lowrey, and Pelletier are 49,350 or $3,138,167; 103,896 or $6,606,747; 41,558 or $2,642,673; 83,116 or $5,285,346; 49,350 or $3,138,167; and 46,754 or $2,973,087, respectively. |
| For 2015, the maximum performance shares and units payable and valued at the grant date price of $78.08 to Messrs. Strangfeld, Falzon, Grier, Lowrey, and Pelletier are 77,556 or $6,055,572; 27,374 or $2,137,362; 63,870 or $4,986,970; 41,060 or $3,205,965; and 36,498 or $2,849,764, respectively. |
| For 2014, the maximum performance shares and units payable and valued at the grant date price of $84.53 to Messrs. Strangfeld, Falzon, Grier, Lowrey, and Pelletier are 72,158 or $6,099,516; 22,073 or $1,865,831; 59,425 or $5,023,195; 38,203 or $3,229,300; and 12,735 or $1,076,490, respectively. Mr. Pelletier received an additional grant upon his promotion to Executive Vice President in April 2014 that has a maximum number of performance shares and performance units payable and valued at the grant date price of $81.17 of 13,108 or $1,063,976. |
| | | | | 64 | | | Notice of Annual Meeting of Shareholders and 2017 Proxy Statement |
| | | | | Executive Compensation
|
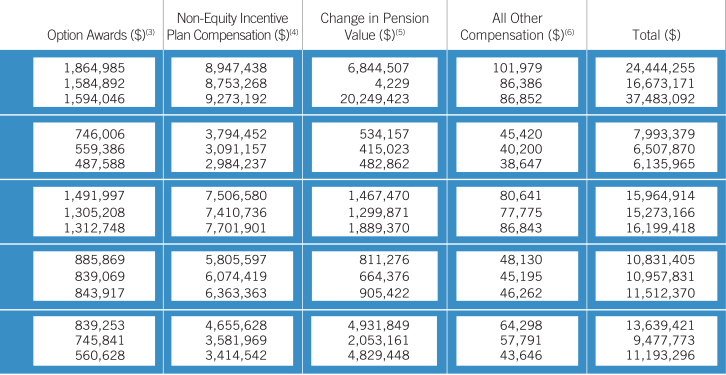
| (3) | The amounts reported in theOptions Awards column represent the aggregate grant date fair value forof stock options granted in each respective year for the prior year’s performance as calculated under ASC Topic 718. The assumptions made in calculating the grant date fair value amounts for these stock options are incorporated herein by reference to the discussion of those assumptions and found below in the Grants of Plan-Based Awards Table. Note that the amounts reported in this column do not necessarily correspond to the actual economic value that will be received by the Named Executive OfficersNEOs from the options. |
| | | | | | | | Notice of Annual Meeting of Shareholders and 2019 Proxy Statement | | | | | 77 |
| | |
| | Executive Compensation | |
| (4) | The aggregate amounts reported in theNon-Equity Incentive Plan Compensation column for 2018 represent annual incentives paid in February 2019 for performance in 2018, excluding 30% of the total annual incentive carved out to the Book Value Performance Program for Messrs. Lowrey, Strangfeld, Falzon, Grier and Pelletier. For Messrs. Tanji and Sleyster, the annual incentive carve out was 10%, as the awards reflect performance in their prior roles; and the value of the book value units paid in February 2019; for 2017, they represent annual incentives paid in February 2018 for performance in 2017, excluding 30% of the total annual incentive carved out to the Book Value Performance Program, and the value of the book value units paid in February 2018, and additionally in April and December 2017 for Mr. Pelletier; for 2016, they represent annual incentives paid in February 2017 for performance in 2016, excluding 30% of the total annual incentive carved out to the Book Value Performance Program;Program, and the value of the book value units paid in February 2017, and additionally in April 2016 for Mr. Pelletier; for 2015 represent annual incentives paid in February 2016 for performance in 2015, excluding 30% of the total annual incentive carved out to the Book Value Performance Program; and the value of the book value units paid in February 2016, and additionally in April 2015 for Mr. Pelletier; for 2014 represent annual incentives paid in February 2015 for performance in 2014, excluding 30% of the total annual incentive carved out to the Book Value Performance Program; and the value of the book value units paid in February 2015:Pelletier, as shown below: |
| | | | | | | | | | | | | | | | | | | | | | | | | | | | 2016 | | | 2015 | | | 2014 | | | Name | | Annual Incentive
Award | | | Book Value Units
Value Paid | | | Annual Incentive
Award | | | Book Value Units
Value Paid | | | Annual Incentive
Award | | | Book Value Units
Value Paid | | | Strangfeld | | $ | 4,183,200 | | | $ | 4,764,238 | | | $ | 4,140,500 | | | $ | 4,612,768 | | | $ | 5,460,000 | | | $ | 3,813,192 | | | Falzon | | $ | 2,093,000 | | | $ | 1,701,452 | | | $ | 1,820,000 | | | $ | 1,266,410 | | | $ | 2,310,000 | | | $ | 658,637 | | | Grier | | $ | 3,556,000 | | | $ | 3,950,580 | | | $ | 3,570,000 | | | $ | 3,840,736 | | | $ | 4,550,000 | | | $ | 3,151,901 | | | Lowrey | | $ | 2,789,500 | | | $ | 2,951,704 | | | $ | 2,975,000 | | | $ | 2,902,390 | | | $ | 3,780,000 | | | $ | 2,346,216 | | | Pelletier | | $ | 2,789,500 | | | $ | 1,866,128 | | | $ | 2,240,000 | | | $ | 1,341,969 | | | $ | 2,800,000 | | | $ | 614,542 | |
| | | | | | | | | | | | | | | | | | | | | | | | | | | | | | | | 2018 | | | 2017 | | | 2016 | | | | | | | | | Name | | Annual Incentive
Award | | | Book Value Units
Value Paid | | | Annual Incentive
Award | | | Book Value Units
Value Paid | | | Annual Incentive
Award | | | Book Value Units
Value Paid | | | | | | | | | | Charles F. Lowrey | | | $2,870,000 | | | | $2,608,046 | | | | $3,108,000 | | | | $2,764,738 | | | | $2,789,500 | | | | $2,951,704 | | | John R. Strangfeld | | | $4,292,400 | | | | $4,496,757 | | | | $4,662,000 | | | | $4,611,376 | | | | $4,183,200 | | | | $4,764,238 | | | Kenneth Y. Tanji | | | $ 990,000 | | | | $ 341,611 | | | | — | | | | — | | | | — | | | | — | | | Robert M. Falzon | | | $2,149,000 | | | | $1,970,395 | | | | $2,331,000 | | | | $1,925,249 | | | | $2,093,000 | | | | $1,701,452 | | | Mark B. Grier | | | $3,640,000 | | | | $3,714,361 | | | | $3,962,000 | | | | $3,816,282 | | | | $3,556,000 | | | | $3,950,580 | | | Stephen Pelletier | | | $2,870,000 | | | | $2,445,371 | | | | $3,290,000 | | | | $2,503,200 | | | | $2,789,500 | | | | $1,866,128 | | | Scott G. Sleyster | | | $1,620,000 | | | | $1,048,958 | | | | — | | | | — | | | | — | | | | — | | | | | | | | |
| | For Mr. Falzon, 2015,Lowrey, 2018, 2017, and 20142016 also include the value of carried interest payments of $4,747$209, $43,090, and $15,600,$64,393, respectively. |
| | For Mr. Lowrey,Falzon, 2018, 2017, and 2016 2015, and 2014 also include the value of carried interest payments of $64,393, $197,029,$887, $3,226, and $237,147,$15,600, respectively. |
| | | | | | | Notice of Annual Meeting of Shareholders and 2017 Proxy Statement | | | | 65 | |
| | | | | Executive Compensation
|
| The carried interest payments relate to carried interest programs in which Mr. Falzon and Mr. Lowrey participate as a result of previous positions held within the Company’s AssetInvestment Management Business. While Mr. Falzon and Mr. Lowrey are no longer entitled to invest in or be granted new carried interests in these programs, they will continue to receive distributions from thesepre-existing arrangements if and when they are earned. |
| (5) | The amounts reported in theChange in Pension Value column represent the change in the actuarial present value of each NEO’s accumulated benefit under the Merged Retirement Plan, the Supplemental Retirement Plan, and the SERPs, as applicable, determined using interest rate and mortality rate assumptions consistent with those used for our consolidated financial statements on December 31, 2013,2015, December 31, 2014,2016, December 31, 2015,2017, and December 31, 2016,2018, as applicable; namely, the RP 2000 generational mortality table with white collar adjustments for 2013, and the RP 2014 generational mortality table with white collar adjustments, and an adjustment to reflect recent Prudential-specific experience for 2014, 2015, 2016, 2017 and 2016,2018, an interest discount rate of 4.95% for 2013, 4.10% for 2014, 4.50% for 2015, and 4.15% for 2016, 3.65% for 2017 and 4.30% for 2018, a Cash Balance Formula interest crediting rate of 4.25% for 2013, 2014, 2015, 2016, 2017, and 2016,2018, and a PSI Cash Balance Formula interest crediting rate of 5.00% for 2013, 2014, 2015, 2016, 2017 and 2016.2018. The amounts represented above may fluctuate significantly in a given year depending on a number of factors that affect the formula to determine pension benefits, including age, years of service, and the measurement of average annual earnings. |
| | Messrs. Strangfeld and Pelletier accrue pension benefits under the Traditional Pension Formula and Messrs. Lowrey, Tanji, Falzon, Grier, and LowreySleyster accrue pension benefits under the Cash Balance Formula (both formulas are described in the “Pension Benefits” section of this Proxy Statement). In accordance with the provisions of the Traditional Pension Formula, the years of earnings used for determining Average Eligible Earnings change every two years (most recently on January 1, 2016)2018). |
| | The amounts reported in this column include payments from the Supplemental Retirement Plan of $2,524$20,990 for Mr. Lowrey, $10,643 for Mr. Falzon, $21,367and $31,095 for Mr. Grier in 2016; $17,274 for Mr. Lowrey, $8,928 for Mr. Falzon, and $11,847,072 for Mr. Grier in 2017; and $16,170 for Mr. Lowrey, $2,026 for Mr. Tanji, $10,819 for Mr. Falzon, $38,848 for Mr. Grier, and $13,899$4,178 for Mr. LowreySleyster in 2014; $5,549 for Mr. Falzon, $29,589 for Mr. Grier and $20,597 for Mr. Lowrey in 2015; and $10,643 for Mr. Falzon, $31,095 for Mr. Grier and $20,990 for Mr. Lowrey in 2016;2018; and above-market interest on the SESP of $82$3,158 for Mr. Strangfeld, $6 for Mr. Falzon, $56 for Mr. Grier, $24 for Mr. Lowrey, and $17 for Mr. Pelletier in 2014; $4,229 for Mr. Strangfeld, $359 for Mr. Falzon, $2,905 for Mr. Grier, $1,235 for Mr. Lowrey and $917 for Mr. Pelletier in 2015; and $10,388 for Mr. Strangfeld, $1,138 for Mr. Falzon, $7,239 for Mr. Grier, $3,158 for Mr. Lowrey, and $2,433 for Mr. Pelletier in 2016. |
| The actual change in pension value2016; $1,341 for Mr. Lowrey, $4,281 for Mr. Strangfeld, $562 for Mr. Falzon, $3,016 for Mr. Grier, and $1,062 for Mr. Pelletier in 2015 was $(382,375). In accordance with SEC instructions, the amount included2017; and $475 for Mr. Lowrey, $1,494 for Mr. Strangfeld, $89 for Mr. Tanji, $210 for Mr. Falzon, $1,057 for Mr. Grier, $380 for Mr. Pelletier, and $365 for Mr. Sleyster in this column for the change in pension value for 2015 is $0.2018. |
| (6) | The amounts reported in theAll Other Compensation column are itemized in the supplemental “All Other Compensation” table below. |
| (7) | Mr. Pelletier was appointed an executive officerMessrs.Tanji and Sleyster became NEOs initially in April 2014.2018. |
| | | | | | | | 78 | | | | | Notice of Annual Meeting of Shareholders and 2019 Proxy Statement |
| | |
| | Executive Compensation | |
All Other Compensation | | | | Year | | | Perquisites(1) | | | PESP Contributions(2) | | | SESP Contributions(2) | | | Total | | | | John R. Strangfeld | | | 2016 | | | $ | 47,964 | | | $ | 8,615 | | | $ | 45,400 | | | $ | 101,979 | | | | | | | Year | | | Perquisites(1) | | | Board Compensation(2) | | | PESP Contributions(3) | | | SESP Contributions(3) | | | Total | | Charles F. Lowrey | | | | 2018 | | | | $ 36,793 | | | | | | $11,000 | | | | $20,792 | | | | $ 68,585 | | | | | 2015 | | | $ | 32,371 | | | $ | 8,615 | | | $ | 45,400 | | | $ | 86,386 | | | | 2017 | | | | $ 20,053 | | | | | | $10,800 | | | | $20,000 | | | | $ 50,853 | | | | | | 2014 | | | $ | 32,437 | | | $ | 8,615 | | | $ | 45,800 | | | $ | 86,852 | | | | 2016 | | | | $ 17,330 | | | | | | $10,600 | | | | $20,200 | | | | $ 48,130 | | John R. Strangfeld* | | | | 2018 | | | | $347,253 | | | | $125,000 | | | | $11,000 | | | | $42,308 | | | | $525,561 | | | | | | 2017 | | | | $ 64,229 | | | | | | $10,800 | | | | $45,200 | | | | $120,229 | | | | | | | 2016 | | | | $ 47,964 | | | | | | $ 8,615 | | | | $45,400 | | | | $101,979 | | Kenneth Y. Tanji | | | | 2018 | | | | $ 1,168 | | | | | | $11,000 | | | | $ 6,856 | | | | $ 19,024 | | | Robert M. Falzon | | | 2016 | | | $ | 17,478 | | | $ | 8,173 | | | $ | 19,769 | | | $ | 45,420 | | | | 2018 | | | | $ 17,657 | | | | | | $11,000 | | | | $20,331 | | | | $ 48,988 | | | | | 2015 | | | $ | 14,800 | | | $ | 8,308 | | | $ | 17,092 | | | $ | 40,200 | | | | 2017 | | | | $ 19,358 | | | | | | $10,800 | | | | $20,000 | | | | $ 50,158 | | | | | | 2014 | | | $ | 15,047 | | | $ | 8,000 | | | $ | 15,600 | | | $ | 38,647 | | | | 2016 | | | | $ 17,478 | | | | | | $ 8,173 | | | | $19,769 | | | | $ 45,420 | | | Mark B. Grier | | | 2016 | | | $ | 33,041 | | | $ | 10,600 | | | $ | 37,000 | | | $ | 80,641 | | | | 2018 | | | | $ 35,151 | | | | | | $11,000 | | | | $36,600 | | | | $ 82,751 | | | | | 2015 | | | $ | 30,175 | | | $ | 10,600 | | | $ | 37,000 | | | $ | 77,775 | | | | 2017 | | | | $ 29,367 | | | | | | $10,800 | | | | $36,800 | | | | $ 76,967 | | | | | | 2014 | | | $ | 39,243 | | | $ | 10,400 | | | $ | 37,200 | | | $ | 86,843 | | | | 2016 | | | | $ 33,041 | | | | | | $10,600 | | | | $37,000 | | | | $ 80,641 | | | Charles F. Lowrey | | | 2016 | | | $ | 17,330 | | | $ | 10,600 | | | $ | 20,200 | | | $ | 48,130 | | | | | | 2015 | | | $ | 14,395 | | | $ | 10,600 | | | $ | 20,200 | | | $ | 45,195 | | | | | | | 2014 | | | $ | 15,470 | | | $ | 10,392 | | | $ | 20,400 | | | $ | 46,262 | | | | Stephen Pelletier | | | 2016 | | | $ | 35,806 | | | $ | 8,292 | | | $ | 20,200 | | | $ | 64,298 | | | | 2018 | | | | $ 40,450 | | | | | | $11,000 | | | | $19,800 | | | | $ 71,250 | | | | | 2015 | | | $ | 29,849 | | | $ | 8,173 | | | $ | 19,769 | | | $ | 57,791 | | | | 2017 | | | | $ 37,926 | | | | | | $10,800 | | | | $20,000 | | | | $ 68,726 | | | | | | 2014 | | | $ | 20,661 | | | $ | 8,077 | | | $ | 14,908 | | | $ | 43,646 | | | | 2016 | | | | $ 35,806 | | | | | | $ 8,292 | | | | $20,200 | | | | $ 64,298 | | Scott G. Sleyster | | | | 2018 | | | | $ 1,318 | | | | | | $11,000 | | | | $10,969 | | | | $ 23,287 | |
| * | Mr. Strangfeld’s last day as CEO was November 30, 2018. |
| (1) | For Messrs. Strangfeld and Grier,all NEOs, the amounts reported in thePerquisites column for 2016 represent the incremental cost for security services of $25,658 and $7,029 respectively, and the costs associated with Company-provided vehicles for personal and commuting purposes of $22,306 and $26,012, respectively. For Messrs, Falzon, Lowrey and Pelletier, the amounts reported represent2018 include the costs of commuting and limited personal use of Company-provided vehicles. The amounts reported in the table for commutingcars and personal use of vehicles reflect our determination of the costs allocable to the actual commuting and personal use of each individual and are based on a formula that takes into account various expenses, including costs associated with the driver and fuel. For Mr. Pelletier, this amount was $40,450 for 2018. In addition, for Messrs. Strangfeld and Grier, the amounts reported for 2018 include the incremental cost for security services, which for Mr. Strangfeld amounted to $217,468, as he changed his principal residence in 2018 resulting in higher security installation costs. Also, for Mr. Strangfeld, the amount reported in 2018 includes $106,100 for the cost of transitional career consulting services. Finally, for certain NEOs, amounts reported for 2018 include the cost of physical examinations. |
| (2) | Mr. Strangfeld received $125,000 for his service as a non-employee Non-Executive Chairman for the month of December 2018. |
| (3) | The amounts reported in thePESP andSESPContributions columns represent our contributions to the account of each NEO under (a) The Prudential Employee Savings Plan (the “PESP”), a defined contribution plan which provides employees with the opportunity to contribute up to 50% of eligible earnings in any combination ofbefore-tax, Roth 401(k) and/orafter-tax contributions (subject to Internal Revenue Code limits) and (b) the Prudential Supplemental Employee Savings Plan, anon-qualified plan which provides employees who exceed the Internal Revenue Code earnings limit ($265,000275,000 in 2016)2018) with the opportunity to defer up to 4% of eligible earnings in excess of the earnings limit. We match 100% of the first 4% of an employee’sbefore-tax or Roth 401(k) deferrals under the PESP (after one year of service) and 100% of an employee’s deferrals under the SESP. |
| | | | | 66 | | | | Notice of Annual Meeting of Shareholders and 20172019 Proxy Statement | | | | | 79 |
| | |
| | Executive Compensation | |
Grants of Plan-Based Awards The following table presents, for each of the NEOs, information concerning awards under our Long-Term Incentive Program (including our Book Value Performance Program) and grants of equity awards made during 20162018 for 20152017 performance. 20162018 Grants of Plan-Based Awards Table
| | | | | | | | | | | | | | | | | | | | | | | | | | | | | | | | | | | | | | | | | | | | | | | Grant Date | | | Estimated Future Payouts
UnderNon-Equity Incentive
Plan Awards ($)(1) | | | Estimated Future Payouts
Under Equity Incentive
Plan Awards(2) | | | All Other
Option
Awards;
Number of
Securities
Underlying
Options (#)(3) | | | Exercise
or Base
Price of
Option
Awards
($/Sh) | | | Grant Date
Fair Value of
Stock and
Option
Awards ($)(4) | | | | | | Number
of Book
Value
Units (#) | | | Target
($) | | | Maximum
($) | | | Target
(#) | | | Maximum
(#) | | | | | John R. Strangfeld, Chairman and Chief Executive Officer | |
| Annual
Incentive |
| | | n/a | | | | | | | | 6,000,000 | | | | 12,000,000 | | | | | | | | | | | | | | | | | | | | | | | | | PS | | | | 2/9/2016 | | | | | | | | | | | | | | | | 41,558 | | | | 51,948 | | | | | | | | | | | | 2,642,673 | | | | | PU | | | | 2/9/2016 | | | | | | | | | | | | | | | | 41,558 | | | | 51,948 | | | | | | | | | | | | 2,642,673 | | | | | Option | | | | 2/9/2016 | | | | | | | | | | | | | | | | | | | | | | | | 126,183 | | | $ | 63.59 | | | | 1,864,985 | | | | | | BVU | | | | 2/9/2016 | | | | 51,292 | | | | 3,774,578 | | | | | | | | | | | | | | | | | | | | | | | | | | Robert M. Falzon, Executive Vice President and Chief Financial Officer | |
| Annual
Incentive |
| | | n/a | | | | | | | | 3,000,000 | | | | 6,000,000 | | | | | | | | | | | | | | | | | | | | | | | | | PS | | | | 2/9/2016 | | | | | | | | | | | | | | | | 16,623 | | | | 20,779 | | | | | | | | | | | | 1,057,057 | | | | | PU | | | | 2/9/2016 | | | | | | | | | | | | | | | | 16,623 | | | | 20,779 | | | | | | | | | | | | 1,057,057 | | | | | Option | | | | 2/9/2016 | | | | | | | | | | | | | | | | | | | | | | | | 50,474 | | | $ | 63.59 | | | | 746,006 | | | | | | BVU | | | | 2/9/2016 | | | | 21,472 | | | | 1,580,124 | | | | | | | | | | | | | | | | | | | | | | | | | | Mark B. Grier, Vice Chairman | |
| Annual
Incentive |
| | | n/a | | | | | | | | 5,100,000 | | | | 10,200,000 | | | | | | | | | | | | | | | | | | | | | | | | | PS | | | | 2/9/2016 | | | | | | | | | | | | | | | | 33,246 | | | | 41,558 | | | | | | | | | | | | 2,114,113 | | | | | PU | | | | 2/9/2016 | | | | | | | | | | | | | | | | 33,246 | | | | 41,558 | | | | | | | | | | | | 2,114,113 | | | | | Option | | | | 2/9/2016 | | | | | | | | | | | | | | | | | | | | | | | | 100,947 | | | $ | 63.59 | | | | 1,491,997 | | | | | | BVU | | | | 2/9/2016 | | | | 42,534 | | | | 3,130,077 | | | | | | | | | | | | | | | | | | | | | | | | | | Charles F. Lowrey, Executive Vice President and Chief Operating Officer, International Businesses | |
| Annual
Incentive |
| | | n/a | | | | | | | | 4,000,000 | | | | 8,000,000 | | | | | | | | | | | | | | | | | | | | | | | | | PS | | | | 2/9/2016 | | | | | | | | | | | | | | | | 19,740 | | | | 24,675 | | | | | | | | | | | | 1,255,267 | | | | | PU | | | | 2/9/2016 | | | | | | | | | | | | | | | | 19,740 | | | | 24,675 | | | | | | | | | | | | 1,255,267 | | | | | Option | | | | 2/9/2016 | | | | | | | | | | | | | | | | | | | | | | | | 59,937 | | | $ | 63.59 | | | | 885,869 | | | | | | BVU | | | | 2/9/2016 | | | | 30,236 | | | | 2,225,067 | | | | | | | | | | | | | | | | | | | | | | | | | | Stephen Pelletier, Executive Vice President and Chief Operating Officer, U.S. | |
| Annual
Incentive |
| | | n/a | | | | | | | | 4,000,000 | | | | 8,000,000 | | | | | | | | | | | | | | | | | | | | | | | | | PS | | | | 2/9/2016 | | | | | | | | | | | | | | | | 18,701 | | | | 23,377 | | | | | | | | | | | | 1,189,197 | | | | | PU | | | | 2/9/2016 | | | | | | | | | | | | | | | | 18,701 | | | | 23,377 | | | | | | | | | | | | 1,189,197 | | | | | Option | | | | 2/9/2016 | | | | | | | | | | | | | | | | | | | | | | | | 56,783 | | | $ | 63.59 | | | | 839,253 | | | | | | BVU | | | | 2/9/2016 | | | | 25,276 | | | | 1,860,061 | | | | | | | | | | | | | | | | | | | | | | | | | |
| | | | | | | | | | | | | | | | | | | | | | | | | | | | | | | | | | | | | | | | | | | | | | | | | | | | | | | | | | Estimated Future Payouts
UnderNon-Equity Incentive
Plan Awards ($)(1) | | | Estimated Future Payouts
Under Equity Incentive
Plan Awards(2) | | | All Other
Option
Awards;
Number of
Securities
Underlying
Options (#)(3) | | | Exercise
or Base
Price of
Option
Awards
($/Sh) | | | Grant Date
Fair Value of
Stock and
Option
Awards ($)(4) | | | | Grant Date | | | Number of Book
Value Units (#) | | | Target
($) | | | Maximum
($) | | | Target
(#) | | | Maximum
(#) | | | | | | | | Charles F. Lowrey, Chief Executive Officer | |
| Annual
Incentive |
| | | n/a | | | | | | | | 4,000,000 | | | | 8,000,000 | | | | | | | | | | | | | | | | | | | | | | | | | PS | | | | 2/13/2018 | | | | | | | | | | | | | | | | 11,690 | | | | 16,074 | | | | | | | | | | | | 1,249,544 | | | | | PU | | | | 2/13/2018 | | | | | | | | | | | | | | | | 11,690 | | | | 16,074 | | | | | | | | | | | | 1,249,544 | | | | | Option | | | | 2/13/2018 | | | | | | | | | | | | | | | | | | | | | | | | 30,885 | | | $ | 106.89 | | | | 854,897 | | | | | | BVU | | | | 2/13/2018 | | | | 25,851 | | | | 2,282,126 | | | | | | | | | | | | | | | | | | | | | | | | | | John R. Strangfeld, Chairman (and Former Chief
Executive Officer) | |
| Annual
Incentive |
| | | n/a | | | | | | | | 6,000,000 | | | | 12,000,000 | | | | | | | | | | | | | | | | | | | | | | | | | PS | | | | 2/13/2018 | | | | | | | | | | | | | | | | 24,611 | | | | 33,841 | | | | | | | | | | | | 2,630,670 | | | | | PU | | | | 2/13/2018 | | | | | | | | | | | | | | | | 24,611 | | | | 33,841 | | | | | | | | | | | | 2,630,670 | | | | | Option | | | | 2/13/2018 | | | | | | | | | | | | | | | | | | | | | | | | 65,020 | | | $ | 106.89 | | | | 1,799,754 | �� | | | | BVU | | | | 2/13/2018 | | | | 45,289 | | | | 3,998,113 | | | | | | | | | | | | | | | | | | | | | | | | | | | | | PS | | | | 11/30/2018 | | | | | | | | | | | | | | | | 30,760 | | | | 42,295 | | | | | | | | | | | | 2,884,058 | | | | | PU | | | | 11/30/2018 | | | | | | | | | | | | | | | | 30,760 | | | | 42,295 | | | | | | | | | | | | 2,884,058 | | | | | Option | | | | 11/30/2018 | | | | | | | | | | | | | | | | | | | | | | | | 81,268 | | | $ | 93.76 | | | | 2,003,256 | | | | | BVU | | | | 11/30/2018 | | | | 21,009 | | | | 2,000,057 | | | | | | | | | | | | | | | | | | | | | | | | | | Kenneth Y. Tanji Executive Vice President and Chief Financial Officer | |
| Annual
Incentive |
| | | n/a | | | | | | | | 852,150 | | | | 1,704,300 | | | | | | | | | | | | | | | | | | | | | | | | | PS | | | | 2/13/2018 | | | | | | | | | | | | | | | | 1,785 | | | | 2,455 | | | | | | | | | | | | 190,799 | | | | | PU | | | | 2/13/2018 | | | | | | | | | | | | | | | | 1,785 | | | | 2,455 | | | | | | | | | | | | 190,799 | | | | | Option | | | | 2/13/2018 | | | | | | | | | | | | | | | | | | | | | | | | 2,357 | | | $ | 106.89 | | | | 65,242 | | | | | BVU | | | | 2/13/2018 | | | | 3,733 | | | | 329,549 | | | | | | | | | | | | — | | | | | | | | | | | | | | Robert M. Falzon, Vice Chairman (and Former Chief Financial Officer) | |
| Annual
Incentive |
| | | n/a | | | | | | | | 3,000,000 | | | | 6,000,000 | | | | | | | | | | | | | | | | | | | | | | | | | PS | | | | 2/13/2018 | | | | | | | | | | | | | | | | 9,845 | | | | 13,537 | | | | | | | | | | | | 1,052,332 | | | | | PU | | | | 2/13/2018 | | | | | | | | | | | | | | | | 9,845 | | | | 13,537 | | | | | | | | | | | | 1,052,332 | | | | | Option | | | | 2/13/2018 | | | | | | | | | | | | | | | | | | | | | | | | 26,008 | | | $ | 106.89 | | | | 719,901 | | | | | BVU | | | | 2/13/2018 | | | | 20,380 | | | | 1,799,146 | | | | | | | | | | | | — | | | | | | | | | | | | | | Mark B. Grier, Vice Chairman | |
| Annual
Incentive |
| | | n/a | | | | | | | | 5,100,000 | | | | 10,200,000 | | | | | | | | | | | | | | | | | | | | | | | | | PS | | | | 2/13/2018 | | | | | | | | | | | | | | | | 19,689 | | | | 27,073 | | | | | | | | | | | | 2,104,557 | | | | | PU | | | | 2/13/2018 | | | | | | | | | | | | | | | | 19,689 | | | | 27,073 | | | | | | | | | | | | 2,104,557 | | | | | Option | | | | 2/13/2018 | | | | | | | | | | | | | | | | | | | | | | | | 52,016 | | | $ | 106.89 | | | | 1,439,803 | | | | | BVU | | | | 2/13/2018 | | | | 37,360 | | | | 3,298,141 | | | | | | | | | | | | | | | | | | | | | | | | | | Stephen Pelletier,(8) Executive Vice President and Chief Operating Officer, U.S. | |
| Annual
Incentive |
| | | n/a | | | | | | | | 4,000,000 | | | | 8,000,000 | | | | | | | | | | | | | | | | | | | | | | | | | PS | | | | 2/13/2018 | | | | | | | | | | | | | | | | 11,690 | | | | 16,074 | | | | | | | | | | | | 1,249,544 | | | | | PU | | | | 2/13/2018 | | | | | | | | | | | | | | | | 11,690 | | | | 16,074 | | | | | | | | | | | | 1,249,544 | | | | | Option | | | | 2/13/2018 | | | | | | | | | | | | | | | | | | | | | | | | 30,885 | | | $ | 106.89 | | | | 854,897 | | | | | BVU | | | | 2/13/2018 | | | | 26,734 | | | | 2,360,078 | | | | | | | | | | | | | | | | | | | | | | | | | | Scott G. Sleyster Executive Vice President and Chief Operating Officer, International Businesses | |
| Annual
Incentive |
| | | n/a | | | | | | | | 1,539,000 | | | | 3,078,000 | | | | | | | | | | | | | | | | | | | | | | | | | PS | | | | 2/13/2018 | | | | | | | | | | | | | | | | 7,384 | | | | 10,153 | | | | | | | | | | | | 789,276 | | | | | PU | | | | 2/13/2018 | | | | | | | | | | | | | | | | 7,384 | | | | 10,153 | | | | | | | | | | | | 789,276 | | | | | Option | | | | 2/13/2018 | | | | | | | | | | | | | | | | | | | | | | | | 9,753 | | | $ | 106.89 | | | | 269,963 | | | | | BVU | | | | 2/13/2018 | | | | 12,370 | | | | 1,092,024 | | | | | | | | | | | | | | | | | | | | | | | | | |
| (1) | The amounts reported in theEstimated Future Payouts UnderNon-Equity Incentive Plan Awards column columns represent the potential amounts for annual incentives for the 20162018 performance year. Actual amounts earned by the NEOs are reflected in the Summary Compensation Table. In addition, individual amounts are reported by grant date to represent the value of the book value units awarded to the NEOs under the Omnibus Plan on February 9, 2016,13, 2018, and November 30, 2018, and reflected in the Number of Book Value Units column, based on the book value per share of the company of $73.59$88.28 as originally reported as of December 31, 2015.2017, and $95.20 as originally reported as of September 30, 2018, respectively. |
| (2) | The amounts reported in theEstimated Future Payouts Under Equity Incentive Plan Awards columns represent performance shares and performance units awarded to the NEOs under the Omnibus Plan in 2016.2018. Performance share and performance unit awards are granted for a three-year performance period with payout determined at the end of the period based on our performance against our ROE goals. The ROE goals for the 20162018 grant are within a range of 10% toand 14%. |
| | | | | | | | 80 | | | | | Notice of Annual Meeting of Shareholders and 2019 Proxy Statement |
| | |
| | Executive Compensation | |
| (3) | The amounts reported in theAll Other Option Awards column represent the number of stock options granted to each Named Executive OfficerNEO under the Omnibus Plan in 2016.2018. These stock options vestone-third each year on the anniversary of the grant date. These stock options expire 10 years from their respective grant date. The exercise price for the February 9, 2016 grant13, 2018 and November 30, 2018 grants of stock options is the closing price of our Common Stock on the grant datedates of February 9, 201613, 2018 ($63.59106.89 per share). and November 30, 2018 ($93.76), respectively. |
| (4) | The amounts in theGrant Date Fair Value column have been calculated in the case of performance shares and performance units as the target number of performance shares and performance units multiplied by the closing price of our Common Stock on the grant date of February 9, 201613, 2018 ($63.59106.89 per share). and November 30, 2018 ($93.76), respectively. |
For stock options, the grant date fair values are hypothetical values developed under a binomial option pricing model, which is a complex, mathematical formula to determine the fair value of stock options on the date of grant. The binomial option pricing model is a flexible, lattice-based valuation model that takes into consideration transferability, fixed estimate of volatility, and expected life of the options. As such, the amounts reported in the table are hypothetical values and may not reflect the actual economic value a Named Executive Officerthe NEO would realize upon exercise. We made the following assumptions when calculating the grant date fair value of the stock option grants: exercise price is equal to our share price on the grant date, and for the grants of February 9, 2016, 5.6113, 2018, 5.49 year life expected for each option, expected dividend yield is 3.92%2.88%, risk-free rate of return of 1.25%2.59%, and expected price volatility of 38.36%35.39%. | | | | | | | | Notice of Annual Meeting of Shareholders and 20172019 Proxy Statement | | | | 67| | | 81 |
| | |
| | Executive Compensation | |
Outstanding Equity Awards The following table provides information on the NEOs’ outstanding equity awards as of December 31, 2016.2018. The equity awards reported in the Stock Awards columns consist of performance share and performance unit awards. The equity awards reported in the Option Awards columns consist ofnon-qualified stock options. 20162018 Outstanding Equity Awards at FiscalYear-End Table
| | | | | | | | | | | | | | | | | | | | | | | | | | | | | | | | | | | | | | | Option Awards(1) | | | Stock Awards | | | | | | | | | | Name | | Grant Date | | | Number of
Securities
Underlying
Unexercised
Options
(# Exercisable) | | | Number of
Securities
Underlying
Unexercised
Options
(# Unexercisable) | | | Option
Exercise
Price ($) | | | Option
Expiration Date | | | Equity Incentive
Plan Awards:
Number of Unearned
Shares, Units or
Rights That Have
Not Vested (#)(2) | | | Equity Incentive
Plan Awards:
Market or Payout
Value of Unearned
Shares, Units or
Rights That Have
Not Vested ($)(2) | | | | | | | | | | Charles F. Lowrey | | | 2/13/2018 | | | | 0 | | | | 30,885 | | | | 106.89 | | | | 2/13/2028 | | | | 32,148 | | | | 2,621,669 | | | | | 2/14/2017 | | | | 12,268 | | | | 24,538 | | | | 110.45 | | | | 2/14/2027 | | | | 35,564 | | | | 2,900,244 | | | | | 2/9/2016 | | | | 19,979 | | | | 19,979 | | | | 63.59 | | | | 2/9/2026 | | | | 49,350 | | | | 4,024,493 | | | | | 2/10/2015 | | | | 45,478 | | | | 0 | | | | 78.08 | | | | 2/10/2025 | | | | | | | | | | | | | | 2/11/2014 | | | | 38,962 | | | | 0 | | | | 84.53 | | | | 2/11/2024 | | | | | | | | | | John R. Strangfeld | | | 11/30/2018 | | | | 0 | | | | 81,268 | | | | 93.76 | | | | 11/30/2028 | | | | 84,590 | | | | 6,898,315 | | | | | 2/13/2018 | | | | 0 | | | | 65,020 | | | | 106.89 | | | | 2/13/2028 | | | | 67,682 | | | | 5,519,467 | | | | | 2/14/2017 | | | | 24,537 | | | | 49,074 | | | | 110.45 | | | | 2/14/2027 | | | | 71,126 | | | | 5,800,325 | | | | | 2/9/2016 | | | | 84,122 | | | | 42,061 | | | | 63.59 | | | | 2/9/2026 | | | | 103,896 | | | | 8,472,719 | | | | | 2/10/2015 | | | | 85,902 | | | | 0 | | | | 78.08 | | | | 2/10/2025 | | | | | | | | | | | | | 2/11/2014 | | | | 73,594 | | | | 0 | | | | 84.53 | | | | 2/11/2024 | | | | | | | | | | | | | 2/12/2013 | | | | 247,094 | | | | 0 | | | | 57.00 | | | | 2/12/2023 | | | | | | | | | | | | | | 2/14/2012 | | | | 223,685 | | | | 0 | | | | 59.41 | | | | 2/14/2022 | | | | | | | | | | Kenneth Y. Tanji | | | 2/13/2018 | | | | 0 | | | | 2,357 | | | | 106.89 | | | | 2/13/2028 | | | | 4,910 | | | | 400,411 | | | | | 2/14/2017 | | | | 889 | | | | 1,780 | | | | 110.45 | | | | 2/14/2027 | | | | 5,158 | | | | 420,635 | | | | | 2/9/2016 | | | | 5,888 | | | | 2,945 | | | | 63.59 | | | | 2/9/2026 | | | | 7,274 | | | | 593,195 | | | | | 2/10/2015 | | | | 9,096 | | | | 0 | | | | 78.08 | | | | 2/10/2025 | | | | | | | | | | | | | 2/11/2014 | | | | 5,195 | | | | 0 | | | | 84.53 | | | | 2/11/2024 | | | | | | | | | | | | | 2/12/2013 | | | | 17,442 | | | | 0 | | | | 57.00 | | | | 2/12/2023 | | | | | | | | | | | | | 2/14/2012 | | | | 11,843 | | | | 0 | | | | 59.41 | | | | 2/14/2022 | | | | | | | | | | | | | | 2/8/2011 | | | | 9,600 | | | | 0 | | | | 64.01 | | | | 2/8/2021 | | | | | | | | | | Robert M. Falzon | | | 2/13/2018 | | | | 0 | | | | 26,008 | | | | 106.89 | | | | 2/13/2028 | | | | 27,074 | | | | 2,207,885 | | | | | 2/14/2017 | | | | 9,815 | | | | 19,630 | | | | 110.45 | | | | 2/14/2027 | | | | 28,450 | | | | 2,320,098 | | | | | 2/9/2016 | | | | 33,649 | | | | 16,825 | | | | 63.59 | | | | 2/9/2026 | | | | 41,558 | | | | 3,389,055 | | | | | 2/10/2015 | | | | 20,213 | | | | 0 | | | | 78.08 | | | | 2/10/2025 | | | | | | | | | | | | | | 2/11/2014 | | | | 7,504 | | | | 0 | | | | 84.53 | | | | 2/11/2024 | | | | | | | | | |
| | | | | | | | | | | | | | | | | | | | | | | | | | | | | | | | | | | Option Awards(1) | | | Stock Awards | | | Name | | Grant Date | | | Number of
Securities
Underlying
Unexercised
Options
(# Exercisable) | | | Number of
Securities
Underlying
Unexercised
Options
(# Unexercisable) | | | Option
Exercise
Price ($) | | | Option
Expiration Date | | | Equity Incentive
Plan Awards:
Number of Unearned
Shares, Units or
Rights That Have
Not Vested (#)(2) | | | Equity Incentive
Plan Awards:
Market or Payout
Value of Unearned
Shares, Units or
Rights That Have
Not Vested ($)(2) | | | John R. Strangfeld | | | 2/9/2016 | | | | — | | | | 126,183 | | | | 63.59 | | | | 2/9/2026 | | | | 103,896 | | | | 10,811,418 | | | | | 2/10/2015 | | | | 28,634 | | | | 57,268 | | | | 78.08 | | | | 2/10/2025 | | | | 77,556 | | | | 8,070,478 | | | | | 2/11/2014 | | | | 49,062 | | | | 24,532 | | | | 84.53 | | | | 2/11/2024 | | | | 72,158 | | | | 7,508,762 | | | | | 2/12/2013 | | | | 247,094 | | | | — | | | | 57.00 | | | | 2/12/2023 | | | | | | | | | | | | | 2/14/2012 | | | | 223,685 | | | | — | | | | 59.41 | | | | 2/14/2022 | | | | | | | | | | | | | | 2/8/2011 | | | | 170,667 | | | | — | | | | 64.01 | | | | 2/8/2021 | | | | | | | | | | | Robert M. Falzon | | | 2/9/2016 | | | | — | | | | 50,474 | | | | 63.59 | | | | 2/9/2026 | | | | 41,558 | | | | 4,324,526 | | | | | 2/10/2015 | | | | — | | | | 20,213 | | | | 78.08 | | | | 2/10/2025 | | | | 27,374 | | | | 2,848,539 | | | | | | 2/11/2014 | | | | — | | | | 7,504 | | | | 84.53 | | | | 2/11/2024 | | | | 22,074 | | | | 2,297,021 | | | Mark B. Grier | | | 2/9/2016 | | | | — | | | | 100,947 | | | | 63.59 | | | | 2/9/2026 | | | | 83,116 | | | | 8,649,051 | | | | | 2/10/2015 | | | | 23,581 | | | | 47,162 | | | | 78.08 | | | | 2/10/2025 | | | | 63,870 | | | | 6,646,313 | | | | | 2/11/2014 | | | | 40,404 | | | | 20,202 | | | | 84.53 | | | | 2/11/2024 | | | | 59,426 | | | | 6,183,870 | | | | | 2/12/2013 | | | | 135,660 | | | | — | | | | 57.00 | | | | 2/12/2023 | | | | | | | | | | | | | | 2/14/2012 | | | | 57,895 | | | | — | | | | 59.41 | | | | 2/14/2022 | | | | | | | | | | | Charles F. Lowrey | | | 2/9/2016 | | | | — | | | | 59,937 | | | | 63.59 | | | | 2/9/2026 | | | | 49,350 | | | | 5,135,361 | | | | | 2/10/2015 | | | | 15,159 | | | | 30,319 | | | | 78.08 | | | | 2/10/2025 | | | | 41,060 | | | | 4,272,704 | | | | | 2/11/2014 | | | | 25,974 | | | | 12,988 | | | | 84.53 | | | | 2/11/2024 | | | | 38,204 | | | | 3,975,509 | | | | | 2/12/2013 | | | | 130,814 | | | | — | | | | 57.00 | | | | 2/12/2023 | | | | | | | | | | | | | | 2/14/2012 | | | | 105,264 | | | | — | | | | 59.41 | | | | 2/14/2022 | | | | | | | | | | | Stephen Pelletier | | | 2/9/2016 | | | | — | | | | 56,783 | | | | 63.59 | | | | 2/9/2026 | | | | 46,754 | | | | 4,865,222 | | | | | 2/10/2015 | | | | 13,475 | | | | 26,950 | | | | 78.08 | | | | 2/10/2025 | | | | 36,498 | | | | 3,797,982 | | | | | 4/7/2014 | | | | 8,909 | | | | 4,455 | | | | 81.17 | | | | 4/7/2024 | | | | 13,108 | | | | 1,364,019 | | | | | 2/11/2014 | | | | 8,658 | | | | 4,330 | | | | 84.53 | | | | 2/11/2024 | | | | 12,736 | | | | 1,325,309 | | | | | 2/14/2012 | | | | 17,105 | | | | — | | | | 59.41 | | | | 2/14/2022 | | | | | | | | | | | | | 2/8/2011 | | | | 11,733 | | | | — | | | | 64.01 | | | | 2/8/2021 | | | | | | | | | | | | | | 2/9/2010 | | | | 2,599 | | | | — | | | | 48.36 | | | | 2/9/2020 | | | | | | | | | |
| | | | | | | | 82 | | | | | Notice of Annual Meeting of Shareholders and 2019 Proxy Statement |
| | |
| | Executive Compensation | |
| | | | | | | | | | | | | | | | | | | | | | | | | | | | | | | | | | | | | | | Option Awards(1) | | | Stock Awards | | | | | | | | | | Name | | Grant Date | | | Number of
Securities
Underlying
Unexercised
Options
(# Exercisable) | | | Number of
Securities
Underlying
Unexercised
Options
(# Unexercisable) | | | Option
Exercise
Price ($) | | | Option
Expiration Date | | | Equity Incentive
Plan Awards:
Number of Unearned
Shares, Units or
Rights That Have
Not Vested (#)(2) | | | Equity Incentive
Plan Awards:
Market or Payout
Value of Unearned
Shares, Units or
Rights That Have
Not Vested ($)(2) | | | | | | | | | | Mark B. Grier | | | 2/13/2018 | | | | 0 | | | | 52,016 | | | | 106.89 | | | | 2/13/2028 | | | | 54,146 | | | | 4,415,606 | | | | | 2/14/2017 | | | | 19,629 | | | | 39,260 | | | | 110.45 | | | | 2/14/2027 | | | | 56,900 | | | | 4,640,195 | | | | | 2/9/2016 | | | | 67,298 | | | | 33,649 | | | | 63.59 | | | | 2/9/2026 | | | | 83,116 | | | | 6,778,110 | | | | | 2/10/2015 | | | | 70,743 | | | | 0 | | | | 78.08 | | | | 2/10/2025 | | | | | | | | | | | | | 2/11/2014 | | | | 60,607 | | | | 0 | | | | 84.53 | | | | 2/11/2024 | | | | | | | | | | | | | 2/12/2013 | | | | 135,660 | | | | 0 | | | | 57.00 | | | | 2/12/2023 | | | | | | | | | | | | | | 2/14/2012 | | | | 57,895 | | | | 0 | | | | 59.41 | | | | 2/14/2022 | | | | | | | | | | Stephen Pelletier | | | 2/13/2018 | | | | 0 | | | | 30,885 | | | | 106.89 | | | | 2/13/2028 | | | | 32,148 | | | | 2,621,669 | | | | | 2/14/2017 | | | | 11,041 | | | | 22,084 | | | | 110.45 | | | | 2/14/2027 | | | | 32,008 | | | | 2,610,252 | | | | | 2/9/2016 | | | | 0 | | | | 18,928 | | | | 63.59 | | | | 2/9/2026 | | | | 46,754 | | | | 3,812,789 | | | | | | 2/14/2012 | | | | 8,553 | | | | 0 | | | | 59.41 | | | | 2/14/2022 | | | | | | | | | | Scott G. Sleyster | | | 2/13/2018 | | | | 0 | | | | 9,753 | | | | 106.89 | | | | 2/13/2028 | | | | 20,306 | | | | 1,655,954 | | | | | 2/14/2017 | | | | 3,190 | | | | 6,380 | | | | 110.45 | | | | 2/14/2027 | | | | 18,494 | | | | 1,508,186 | | | | | 2/9/2016 | | | | 21,872 | | | | 10,936 | | | | 63.59 | | | | 2/9/2026 | | | | 27,014 | | | | 2,202,992 | | | | | 2/10/2015 | | | | 24,760 | | | | 0 | | | | 78.08 | | | | 2/10/2025 | | | | | | | | | | | | | 2/11/2014 | | | | 8,659 | | | | 0 | | | | 84.53 | | | | 2/11/2024 | | | | | | | | | | | | | 2/12/2013 | | | | 23,983 | | | | 0 | | | | 57.00 | | | | 2/12/2023 | | | | | | | | | | | | | | 6/12/2012 | | | | 5,935 | | | | 0 | | | | 47.61 | | | | 6/12/2022 | | | | | | | | | |
| (1) | The options reported in theOption Awards column vest at the rate ofone-third per year on the anniversary of the date of grant. |
| (2) | TheEquity Incentive Plan Awards columns reflect the number of outstanding performance shares and performance units that would be received by each Named Executive OfficerNEO at the maximum payout level for the 2017, 2016 2015 and 20142015 grants. The dollar values reported represent the estimated value of the outstanding performance shares and performance units at the maximum payout level for the 2017, 2016 2015 and 20142015 grants, based on the closing market price for our Common Stock on the last trading day of the year, December 31, 201629, 2017 ($104.06114.98 per share). Performance shares and performance units are subject to a three-year performance period with payout determined at the end of the period based on our performance against our ROE goals. |
Grants were made for three-year performance cycles with the 2014 grant as the 2014-2016 performance cycle, the 2015 grant as the 2015-2017 performance cycle, and the 2016 grant as the 2016-2018 performance cycle, the 2017 grant as the 2017-2019 performance cycle, and the 2018 grant as the 2018-2020 performance cycle. | | | | | 68 | | | Notice of Annual Meeting of Shareholders and 2017 Proxy Statement |
| | | | | Executive Compensation
|
Option Exercises and Stock Vested The following table provides information on the value realized by each of the NEOs as a result of the exercise of stock options and the vesting of stock awards that vested from January 1, 20162018 through December 31, 2016.2018. 20162018 Option Exercises and Stock Vested Table
| | | | | | | | | | | | | Option Awards | | | Stock Awards | | | | | Option Awards | | | Stock Awards | | | | Name | | Number of Shares
Acquired on Exercise
(#) | | | Value Realized
On Exercise
($) | | | Number of Shares
Acquired on Vesting (#)1 | | | Value
Realized
on Vesting (#)2 | | | Number of Shares
Acquired on Exercise
(#) | | | Value Realized
On Exercise ($) | | | Number of Shares
Acquired on Vesting (#)(1) | | | Value
Realized
on Vesting (#)(2) | | Charles F. Lowrey | | | | 0 | | | | 0 | | | | 18,133 | | | | 1,938,236 | | | John R. Strangfeld | | | 490,938 | | | | 11,052,346 | | | | 44,357 | | | | 2,820,662 | | | | 0 | | | | 0 | | | | 34,249 | | | | 3,660,876 | | Kenneth Y. Tanji | | | | 0 | | | | 0 | | | | 3,627 | | | | 387,690 | | | Robert M. Falzon | | | 63,873 | | | | 934,172 | | | | 10,437 | | | | 663,689 | | | | 0 | | | | 0 | | | | 12,088 | | | | 1,292,086 | | | Mark B. Grier | | | 66,310 | | | | 152,158 | | | | 36,530 | | | | 2,322,943 | | | | 0 | | | | 0 | | | | 28,205 | | | | 3,014,832 | | | Charles F. Lowrey | | | 201,056 | | | | 4,331,934 | | | | 23,483 | | | | 1,493,284 | | | | Stephen Pelletier | | | 42,657 | | | | 904,350 | | | | 7,829 | | | | 497,846 | | | | 32,403 | | | | 1,261,178 | | | | 16,118 | | | | 1,722,853 | | Scott G. Sleyster | | | | 23,300 | | | | 1,734,461 | | | | 9,872 | | | | 1,055,218 | |
| (1) | The amounts in theStock Awards—Number of Shares Acquired on Vesting column represent the payout of shares of our Common Stock for the vesting of the 20132015 performance shares grants and payout of the 20132015 performance units as cash. |
| (2) | The amounts in theStock Awards—Value Realized on Vesting column represent the product of the number of performance shares and performance units released and the closing sale price of our Common Stock on February 9, 2016, $63.59.13, 2018, $106.89. |
| | | | | | | | Notice of Annual Meeting of Shareholders and 2019 Proxy Statement | | | | | 83 |
| | |
| | Executive Compensation | |
Pension Benefits The following table provides information on the defined benefit retirement plans in which the NEOs participate, including the present value of accumulated benefits as of December 31, 2016,2018, except as noted, payable for each of the NEOs under each of these plans determined using interest rate and mortality rate assumptions consistent with those used in our consolidated financial statements; namely, the RP 2014 generational mortality table with white collar adjustments and an adjustment to reflect recent Prudential-specific experience and an interest discount rate of 4.15%4.30%. Cash Balance Formula accounts are assumed to grow with interest based on assumed30-year Treasury Rate, but not less than 4.25%, and PSI Cash Balance Formula accounts are assumed to grow with interest at 4.25% and 5.00%, respectively, until commencement of pension benefits. No additional earnings or service after December 31, 20162018 are included in the calculation of the accumulated benefits. 20162018 Pension Benefits Table
| | | Name | | Plan Name | | Number of Years of Credited Service (#) | | | Present Value of Accumulated Benefit ($) | | | Payments During Last Fiscal Year ($) | | | Plan Name | | Number of Years of
Credited Service
(#) | | | Present Value of
Accumulated Benefit
($) | | | Payments During
Last Fiscal Year
($) | | | John R. Strangfeld | | Merged Retirement Plan—Traditional Benefit Formula | | | 39 | | | $ | 3,366,600 | | | | — | | | Charles F. Lowrey | | | Merged Retirement Plan—Cash Balance Formula | | | 17 | | | | $ 2,117,671 | | | | — | | | | | | Supplemental Retirement Plan—Cash Balance Formula | | | 17 | | | | $ 3,897,642 | | |
| $ 16,170
| (3)
| John R. Strangfeld(6) | | | Merged Retirement Plan—Traditional Benefit Formula | | | 41 | | | | $ 3,327,046 | | | | — | | | | | Supplemental Retirement Plan—Traditional Pension Formula | | | 41 | | | | $88,136,857 | | | | — | | | | | | Supplemental Retirement Plan—Cash Balance Formula | | | n/a | (1) | | | $ 37,741 | | | | — | | Kenneth Y. Tanji | | | Merged Retirement Plan—Cash Balance Formula | | | 29 | (2) | | | $ 1,025,605 | | | | — | | | | Supplemental Retirement Plan—Traditional Pension Formula | | | 39 | | | $ | 78,916,344 | | | | — | | | Merged Retirement Plan—PSI Cash Balance Formula | | | n/a | (2) | | | $ 72,219 | | | | — | | | | | Supplemental Retirement Plan—Cash Balance Formula | | | n/a | (1) | | $ | 35,305 | | | | — | | | Supplemental Retirement Plan—Cash Balance Formula | | | 29 | (2) | | | $ 703,883 | | |
| $ 2,026
| (3)
| | Robert M. Falzon | | Merged Retirement Plan—Cash Balance Formula | | | 33 | (2) | | $ | 1,416,208 | | | | — | | | Merged Retirement Plan—Cash Balance Formula | | | 35 | (2) | | | $ 1,583,103 | | | | — | | | | Merged Retirement Plan—PSI Cash Balance Formula | | | n/a | (2) | | $ | 79,995 | | | | — | | | Merged Retirement Plan—PSI Cash Balance Formula | | | n/a | (2) | | | $ 85,539 | | | | — | | | | | Supplemental Retirement Plan—Cash Balance Formula | | | 33 | (2) | | $ | 1,172,293 | | | $ | 10,643 | (3) | | Supplemental Retirement Plan—Cash Balance Formula | | | 35 | (2) | | | $ 2,043,689 | | |
| $ 10,819
| (3)
| | Mark B. Grier | | Merged Retirement Plan—Cash Balance Formula | | | 21 | | | $ | 2,453,655 | | | | — | | | Merged Retirement Plan—Cash Balance Formula | | | 23 | | | | $ 2,717,908 | | | | — | | | | | Supplemental Retirement Plan—Cash Balance Formula | | | 21 | | | $ | 10,360,074 | | | $ | 31,095 | (3) | | Supplemental Retirement Plan—Cash Balance Formula | | | 23 | | | | $ 947,529 | | |
| $ 38,848
| (3)
| | Charles F. Lowrey | | Merged Retirement Plan—Cash Balance Formula | | | 15 | | | $ | 1,905,356 | | | | — | | | | | | Supplemental Retirement Plan—Cash Balance Formula | | | 15 | | | $ | 2,593,622 | | | $ | 20,990 | (3) | | | Stephen Pelletier | | Merged Retirement Plan—Traditional Benefit Formula | | | 18 | | | $ | 1,262,686 | | | | — | | | Merged Retirement Plan—Traditional Benefit Formula | | | 20 | | | | $ 1,518,288 | | | | — | | | | Merged Retirement Plan—Cash Balance Formula | | | n/a | (1) | | $ | 5,660 | | | | — | | | Merged Retirement Plan—Cash Balance Formula | | | n/a | (1) | | | $ 6,142 | | | | — | | | | Merged Retirement Plan—PSI Cash Balance Formula | | | n/a | (4) | | $ | 109,234 | | | | — | | | Merged Retirement Plan—PSI Cash Balance Formula | | | n/a | (4) | | | $ 118,135 | | | | — | | | | Supplemental Retirement Plan—Traditional Pension Formula | | | 18 | | | $ | 17,551,601 | | | | — | | | Supplemental Retirement Plan—Traditional Pension Formula | | | 20 | | | | $ 967,214 | | |
| $30,786,075
| (5)
| | | | PSI Supplemental Retirement Plan for Executives | | | n/a | (4) | | $ | 400,733 | | | | — | | | PSI Supplemental Retirement Plan for Executives | | | n/a | (4) | | | $ 533,628 | | | | — | | Scott G. Sleyster | | | Merged Retirement Plan—Cash Balance Formula | | | 31 | | | | $ 2,891,174 | | | | — | | | | | | Supplemental Retirement Plan—Cash Balance Formula | | | 31 | | | | $ 1,655,903 | | |
| $ 4,178
| (3)
|
| (1) | This benefit is a result of an allocation of demutualization compensation distributed to all participants in the Merged Retirement Plan in 2002 (“Demutualization Credit”). Ongoing service is not a consideration in determining this benefit for the NEOs. |
| (2) | Mr. Tanji transferred from Prudential to Prudential Securities Incorporated in 1994 and transferred back to Prudential from Prudential Securities Incorporated in 2002. He began accruing pension benefits under the Traditional Pension Formula and, subsequently, the Cash Balance Formula upon his election of this formula in 2001; in accordance with the Merged Retirement Plan Cash Balance Formula, credited service includes service with the Company’s subsidiaries, in particular Prudential Securities Incorporated. As a result of his transfer, ongoing service is not a consideration in determining his benefit under the PSI Cash Balance Formula. |
| Mr. Falzon transferred to Prudential from Prudential Securities Incorporated in 1998 and began accruing pension benefits under the Traditional Pension Formula and, subsequently, the Cash Balance Formula upon his election of this formula in 2001; in accordance with the Merged Retirement Plan Cash Balance Formula, credited service includes service with the Company’s subsidiaries, in particular Prudential Securities Incorporated. As a result of his transfer, ongoing service is not a consideration in determining his benefit under the PSI Cash Balance Formula. |
| (3) | ThisFor Messrs. Lowrey, Tanji, Falzon, and Sleyster, this payment was a distribution from the Supplemental Retirement Plan Cash Balance Formula to pay for accrued FICA taxes due and accrued in 20152017 on this benefit, and federal, state, and local taxes on the distributed amount. The entire payment was withheld to pay these taxes. |
| For Mr. Grier, this payment was a complete distribution of the remaining accruals under the Supplemental Retirement Plan for 2017, less applicable FICA, federal, state, and local taxes withheld on the distributed amount. The benefit accrued during the remainder of 2018 will be paid in early 2019 under the terms of the plan. |
| (4) | Mr. Pelletier transferred to Prudential from Prudential Securities Incorporated in 1998 and began accruing pension benefits under the Traditional Pension Formula. As a result, ongoing service is not a consideration in determining thishis benefit. |
| (5) | For Mr. Pelletier, the terms of the Supplemental Retirement Plan require a participant in active service on the first day of the month on or following his or her 65th birthday to receive his or her benefit on that date. In accordance with these terms, Mr. Pelletier received a distribution of $30,786,075. The Supplemental Retirement Plan benefit accrued during the remainder of 2018 will be paid in early 2019 under the terms of the plan. |
| (6) | Mr. Strangfeld will be paid his benefit in the form of a lump sum under the terms of the Supplemental Retirement Plan on June 1, 2019. The present value shown represents the benefit accrued through his retirement date of November 30, 2018. |
| | | | | | | | 84 | | | | | Notice of Annual Meeting of Shareholders and 2019 Proxy Statement |
| | |
| | Executive Compensation | |
The Merged Retirement Plan Our wholly owned subsidiary, The Prudential Insurance Company of America, sponsors ourtax-qualified defined benefit retirement plan, The Prudential Merged Retirement Plan (the “Merged Retirement Plan”), which is available to our executive officers, including the NEOs, and other salaried U.S. employees. The Merged Retirement Plan has two formulas under which | | | | | | | Notice of Annual Meeting of Shareholders and 2017 Proxy Statement | | | | 69 | |
| | | | | Executive Compensation
|
participants may have their retirement benefits for ongoing service determined: the “Traditional Pension Formula” or the “Cash Balance Formula.” In addition, employees who previously worked for Prudential Securities Incorporated also have retirement benefits for their service with Prudential Securities Incorporated under a third component of the Merged Retirement Plan: the “PSI Cash Balance Formula.” TRADITIONAL PENSION FORMULA Under the Traditional Pension Formula, employees are fully vested in their accrued benefits. These benefits (which are subject to Internal Revenue Code limits) are determined using the following formula, which is based on Average Eligible Earnings (as defined) and years of Credited Service (as defined): | | (1.35% x Average Eligible Earnings up to Covered Compensation + 2%2.00% x Average Eligible Earnings in excess of Covered Compensation)
× Years of Credited Service up to 25 years + (0.75% x Average Eligible Earnings up to Covered Compensation + 1%1.00% x Average Eligible Earnings in excess of Covered Compensation)
× Years of Credited Service for the next 13 years + 1%1.00% x Average Eligible Earnings
× Years of Credited Service in excess of 38 years |
For a separation from service in 2016,2018, Average Eligible Earnings are determined by taking the average of earnings (base salary plus annual incentive payment) over the period beginning January 1, 2009,2011, and ending on the date of separation after dropping the lowest two years of earnings in that period. Under the Traditional Pension Formula, the starting point for the averaging period is moved forward two years on January 1 of every even calendar year. “Covered Compensation” for a year is the average of the Social Security wage bases for the 35 years ending in the year the participant will reach Social Security normal retirement age. Benefits are payable as early as age 55 (with a reduction in benefits) as a single life annuity if not married or an actuarially equivalent 50% joint and survivor annuity if married. Generally, a participant’s benefit will be determined as the greater of: the benefit as determined above calculated at the time of separation from service; the benefit as determined above calculated as of January 1, 2002, plus all or a portion of the Supplemental Retirement Plan benefit calculated as of January 1, 2002; and If the Supplemental Retirement Plan benefit is to be paid in the form of an annuity, the benefit as determined above calculated as of January 1, 2012 (including any adjustment in the benefit on January 1, 2002 as described in the previous bullet), plus all or a portion of the Supplemental Retirement Plan benefit calculated as of January 1, 2012. (Messrs. Strangfeld and Pelletier each elected to receive their Supplemental Retirement Plan benefit in the form of a lump sum; consequently, this provision does not apply to them.) Additional benefits are provided to participants who are eligible to retire upon separation from service. A participant is eligible to retire if he or she separates from service either: (a) after attainment of age 55 (with 10 years of vesting service) or age 65 or (b) due to an involuntary termination (other than for cause or exhausting short-term disability benefits) after attainment of age 50 (with 20 years of continuous service). If a participant is eligible to retire, he or she is eligible for survivor benefits (with no actuarial reduction), a lesser (or no) reduction in benefit for benefit commencement before age 65, and an additional benefit paid to age 65. | | | | | | | | Notice of Annual Meeting of Shareholders and 2019 Proxy Statement | | | | | 85 |
| | |
| | Executive Compensation | |
The benefits reported in the Pension Benefits Table above are assumed to commence in the form of a 50% joint and survivor annuity on the later of January 1, 20172019 and the date the participant is eligible for an unreduced benefit, i.e., the earlier of (i) the first of the month on or following the later of attainment of age 60 and 30 years of service and (ii) the first of the month on or following attainment of age 65 (“Normal Retirement Date”). | | | | | 70 | | | Notice of Annual Meeting of Shareholders and 2017 Proxy Statement |
| | | | | Executive Compensation
|
CASH BALANCE FORMULA The Cash Balance Formula was added to the Merged Retirement Plan in 2001 for employees hired on or after January 1, 2001, except employees of Prudential Securities Incorporated. At that time, we offered aone-time conversion election for the current Merged Retirement Plan participants with benefits under the Traditional Pension Formula to opt to have their individual retirement benefits determined under the Cash Balance Formula. Participants who made this election to use the Cash Balance Formula are fully vested in their Cash Balance Formula benefit. Otherwise, participants are generally vested in their Cash Balance Formula benefit after three years of service. Cash Balance Formula benefits (which are subject to Internal Revenue Code limits) are computed using a cash balance methodology that provides for credits to be made to a hypothetical account that is allocated basic credits equal to 2% to 14% (depending on age and service) of base salary and annual incentive payments. Interest credits are made to the hypothetical account each month using an interest rate set each year based on the average yield on30-year U.S. Treasury securities (constant maturities) for October of the prior year, with a minimum rate of 4.25%. The rate in effect for 20162018 was 4.25%. Active participants on June 30, 2003 received an additional credit equal to his or her Supplemental Retirement Plan Cash Balance Formula benefit determined as of January 1, 2002, if any. Active participants on June 30, 2012 received an additional credit of no more than his or her Supplemental Retirement Plan Cash Balance Formula benefit determined as of April 1, 2012, if any. Benefits are payable at any time after separation of service as a lump sum amount (based on the account balance) or an actuarially equivalent single life annuity; 50%, 75%, or 100% joint and survivor annuity; or 50% contingent annuity. Employees who made theone-time conversion election to use the Cash Balance Formula (specifically, Messrs. Tanji, Falzon, Grier and Grier)Sleyster) have a frozen “Grandfathered Benefit” determined as the accrued benefit under the Traditional Pension Formula as of January 1, 2002. The value of the Grandfathered Benefit, and early retirement subsidies on this benefit, if applicable, are included in determining the payable benefit. As reported in the Pension Benefits Table, cash balance accounts are assumed to grow with interest until, and benefits will commence on: for Messrs. Strangfeld and Pelletier (whose Cash Balance Formula benefits are due only to the Demutualization Credit), the same date benefits are assumed to commence under the Traditional Pension Formula; and for Messrs. Lowrey, Tanji, Falzon, Grier and Lowrey,Sleyster, the participant’s Normal Retirement Date. Benefits are assumed to commence in a form that is based on a value comparison between a lump sum and a 50% joint and survivor annuity. PSI CASH BALANCE FORMULA The PSI Cash Balance Formula applies only to employees who previously worked for Prudential Securities Incorporated. At this time, all participants are fully vested in their PSI Cash Balance Formula benefit. Messrs. Tanji, Falzon and Pelletier are the only NEOs with a benefit under this formula. PSI Cash Balance Formula benefits (which are subject to Internal Revenue Code limits) are computed using a cash balance methodology that provides for credits to be made to a hypothetical account. Prior to January 1, 2004, the hypothetical accounts were allocated basic credits equal to 1.7% to 7% (depending on age and service) of eligible earnings. Since then, interest credits only have been made to the hypothetical account each month using an interest rate set each year, with a minimum rate of 5.00%. The rate in effect for 20162018 was 5.00%. Benefits are payable at any time after separation of service as a lump sum amount (based on the account balance) or an actuarially equivalent single life annuity; 50%, 75%, or 100% joint and survivor annuity; 50% or 100% contingent annuity; or single life annuity with 5five or 10 years guaranteed. | | | | | | | | 86 | | | | | Notice of Annual Meeting of Shareholders and 2019 Proxy Statement |
| | |
| | Executive Compensation | |
As reported in the Pension Benefits Table, PSI Cash Balance accounts are assumed to grow with interest until, and benefits will commence on: for Mr.Messrs. Tanji and Falzon, the participant’s Normal Retirement Date; and for Mr. Pelletier, the same date benefits are assumed to commence under the Traditional Pension Formula. Benefits are assumed to commence with 90% of participants electing a lump sum and 10% electing a 50% joint and survivor annuity. | | | | | | | Notice of Annual Meeting of Shareholders and 2017 Proxy Statement | | | | 71 | |
| | | | | Executive Compensation
|
The Supplemental Retirement Plan and SERPs The Supplemental Retirement Plan is anon-qualified retirement plan designed to complement the Merged Retirement Plan by providing benefits to all participants of the Merged Retirement Plan, including the NEOs, who are prohibited from receiving additional benefits under the Merged Retirement Plan because of Internal Revenue Code limits. Benefits under the Supplemental Retirement Plan are generally payable at the earlier of six months after separation from service and age 65. Under a special rule applicable to the Supplemental Retirement Plan, benefits are required to begin to be paid to a home office participant following attainment of age 65, regardless of whether he or she has separated from service. The Prudential Insurance Supplemental Executive Retirement Plan and the PFI Supplemental Executive Retirement Plan (collectively, the “Prudential SERPs”) provide “Early Retirement Benefits” to certain eligible executives, including the NEOs, subject to the approval of our Board and the Committee. Early Retirement Benefits are designed to recognize the service and contributions of eligible executives who are involuntarily terminated by exempting them from the reduction factor for early retirement between the ages of 55 and 65, a reduction of up to 50%, which would otherwise be applicable under the Traditional Pension Formula and the Grandfathered Benefit under the Cash Balance Formula of the Merged Retirement Plan and the Supplemental Retirement Plan. Benefits under the Prudential SERPs are generally payable at the earlier of six months after separation from service and age 65. No NEO is currently eligible for benefits under the Early Retirement Benefits provision. Upon an involuntary termination of employment, Messrs. Lowrey, Strangfeld, Tanji, Grier, and LowreyPelletier will not be eligible for benefits under the Early Retirement Benefits provision due to a variety of factors; Messrs. Falzon and PelletierSleyster are potentially eligible for benefits under the Early Retirement Benefits provision. However, were Mr. Falzon or Mr. Sleyster to qualify for Early Retirement Benefits, only the Grandfathered Benefit portion of histheir benefits would not be subject to reduction. In 2008, the NEOs (with the exception of Mr. Lowrey) were permitted to make an irrevocable election regarding the form of payment for their pension benefits and each NEO (with the exception of Mr. Falzon)Falzon and Mr. Sleyster) elected to receive his Supplemental Retirement Plan and Prudential SERPs benefits, if any, in a lump sum. The Prudential Securities Incorporated Supplemental Retirement Plan for Executives (“PSI SERP”) was designed to make it more attractive to certain key executives to remain employees of Prudential Securities Incorporated and its subsidiaries. Mr. Pelletier is the only NEO that is accruing benefits under the PSI SERP. Mr. Pelletier’s PSI SERP benefit will be paid as an annuity upon separation from service, irrespective of age. The PSI SERP benefit is determined as a target benefit, less the benefit payable from the PSI Cash Balance Formula and an estimated Social Security retirement benefit. The target benefit is 60% of an employee’s average salary times a ratio of service to 30 years. Mr. Pelletier stopped accruing service credit under this plan upon his transfer to Prudential from Prudential Securities Incorporated. Notwithstanding the foregoing, benefits reported in the Pension Benefits Table are assumed to commence in the same form of payment elected for this benefit, either an annuity or a lump sum, and at the same time as under the Merged Retirement Plan benefit to be consistent with assumptions used in the Company’s financial statements. | | | | | | | | Notice of Annual Meeting of Shareholders and 2019 Proxy Statement | | | | | 87 |
| | |
| | Executive Compensation | |
Nonqualified Deferred Compensation The following table provides information on the NEOs’ participation in the Prudential Supplemental Employee Savings Plan (The(the “SESP”) and the Deferred Compensation Plan: 20162018 Nonqualified Deferred Compensation Table
| | | | | | | | | | | | | | | | | | | | | | | | | | Name | | Plan | | | Executive
Contributions in Last
Fiscal Year ($)(1) | | | Registrant
Contributions in Last
Fiscal Year ($)(2) | | | Aggregate
Earnings in Last
Fiscal Year ($)(3) | | | Aggregate
Withdrawals/
Distributions ($) | | | Aggregate Balance
at Last Fiscal Year End ($)(4) | | | John R. Strangfeld | | | SESP | | | $ | 45,400 | | | $ | 45,400 | | | $ | 45,788 | | | | | | | $ | 1,407,990 | | | | | | Deferred Compensation | | | $ | — | | | $ | — | | | $ | 1,474,976 | | | $ | — | | | $ | 9,762,441 | | | Robert M. Falzon | | | SESP | | | $ | 19,769 | | | $ | 19,769 | | | $ | 4,909 | | | | | | | $ | 172,044 | | | | | | Deferred Compensation | | | $ | — | | | $ | — | | | $ | 189,361 | | | $ | — | | | $ | 2,541,179 | | | Mark B. Grier | | | SESP | | | $ | 37,000 | | | $ | 37,000 | | | $ | 31,869 | | | | | | | $ | 987,646 | | | | | | Deferred Compensation | | | $ | — | | | $ | — | | | $ | — | | | $ | — | | | $ | — | | | Charles F. Lowrey | | | SESP | | | $ | 20,200 | | | $ | 20,200 | | | $ | 13,877 | | | | | | | $ | 437,522 | | | | | | Deferred Compensation | | | $ | — | | | $ | — | | | $ | 632,849 | | | $ | — | | | $ | 12,492,842 | �� | | Stephen Pelletier | | | SESP | | | $ | 20,200 | | | $ | 20,200 | | | $ | 10,659 | | | | | | | $ | 342,360 | | | | | | Deferred Compensation | | | $ | — | | | $ | — | | | $ | 1,217,282 | | | $ | — | | | $ | 11,956,082 | |
| | | | | | | | | | | | | | | | | | | | | | | | | | | | | | | | | | | | | | Name | | Plan | | Executive
Contributions in Last
Fiscal Year ($)(1) | | Registrant
Contributions in Last
Fiscal Year ($)(2) | | Aggregate Earnings in Last
Fiscal Year ($)(3) | | Aggregate
Withdrawals/
Distributions ($) | | Aggregate Balance
at Last Fiscal
Year End ($)(4) | Charles F. Lowrey | | | | SESP | | | | $ | 20,792 | | | | $ | 20,792 | | | | $ | 17,721 | | | | | | | | | $ | 552,598 | | | | | | | Deferred Compensation | | | | $ | — | | | | $ | — | | | | $ | 661,505 | | | | $ | — | | | | $ | 13,907,673 | | John R. Strangfeld | | | | SESP | | | | $ | 42,308 | | | | $ | 42,308 | | | | $ | 55,489 | | | | | | | | | $ | 1,689,056 | | | | | | | Deferred Compensation | | | | $ | — | | | | $ | — | | | | $ | (1,175,624 | ) | | | $ | — | | | | $ | 9,769,223 | | Kenneth Y. Tanji | | | | SESP | | | | $ | 6,856 | | | | $ | 6,856 | | | | $ | 3,305 | | | | | | | | | $ | 108,922 | | | | | | | Deferred Compensation | | | | $ | — | | | | $ | — | | | | $ | 270,843 | | | | $ | — | | | | $ | 4,800,789 | | Robert M. Falzon | | | | SESP | | | | $ | 20,331 | | | | $ | 20,331 | | | | $ | 8,102 | | | | | | | | | $ | 267,286 | | | | | | | Deferred Compensation | | | | $ | 466,200 | | | | $ | — | | | | $ | (60,918 | ) | | | $ | — | | | | $ | 3,776,710 | | Mark B. Grier | | | | SESP | | | | $ | 36,600 | | | | $ | 36,600 | | | | $ | 39,386 | | | | | | | | | $ | 1,209,401 | | | | | | | Deferred Compensation | | | | $ | — | | | | $ | — | | | | $ | — | | | | $ | — | | | | $ | — | | Stephen Pelletier | | | | SESP | | | | $ | 19,800 | | | | $ | 19,800 | | | | $ | 14,270 | | | | | | | | | $ | 448,670 | | | | | | | Deferred Compensation | | | | $ | — | | | | $ | — | | | | $ | (891,408 | ) | | | $ | — | | | | $ | 12,488,477 | | Scott G. Sleyster | | | | SESP | | | | $ | 10,969 | | | | $ | 10,969 | | | | $ | 13,466 | | | | | | | | | $ | 414,777 | | | | | | | Deferred Compensation | | | | $ | 470,244 | | | | $ | — | | | | $ | (2,087,364 | ) | | | $ | — | | | | $ | 13,528,823 | |
| (1) | The amounts reported in the Executive Contributions in Last Fiscal Year column represent elective contributions of a portion of their base salary to the SESP (which amounts are also included in the Salary columnColumn of the Summary Compensation Table) and elective contributions to the Deferred Compensation Plan from the annual Bonus column. |
| | | | | 72 | | | Notice of Annual Meeting of Shareholders and 2017 Proxy Statement |
| | | | | Executive Compensation
Bonus. |
| (2) | The amounts reported in the Registrant Contributions in Last Fiscal Year column represent the Company’s contributions to each NEO’s SESP account (which amounts are also included in the All Other Compensation column of the Summary Compensation Table). |
| (3) | The amounts reported in the Aggregate Earnings in Last Fiscal Year column include amounts reported for above-market interest on the SESP in the Change in Pension Value column of the Summary Compensation Table. Specifically, $10,388$475 for Mr. Lowrey, $1,494 for Mr. Strangfeld, $1,138$89 for Mr. Tanji, $210 for Mr. Falzon, $7,239$1,057 for Mr. Grier, $3,158$380 for Mr. LowreyPelletier, and $2,433$365 for Mr. Pelletier.Sleyster. |
| (4) | The amounts reported in the Aggregate Balance at Last FiscalYear-End column represent balances from the SESP and the Deferred Compensation Plan and include various amounts previously reported in the Summary Compensation Table as Salary, Bonus or All Other Compensation. |
SESP The SESP is anon-qualified profit-sharing plan designed to provide benefits in excess of amounts permitted to be contributed under the PESP. It allows employees, including the NEOs, to elect to defer from 1% to 4% of their eligible earnings paid after the Code limit is exceeded in the year ($265,000275,000 in 2016)2018) to a hypothetical recordkeeping account on apre-tax basis through payroll deduction. We match 100% of an employee’s deferrals. Eligible earnings for the NEOs under the SESP are limited to base salary only. Interest is earned on a participant’s account at the same rate as the Fixed Rate Fund under the PESP. This rate is generally set quarterly within a calendar year, and the rate in effect for each quarter of 20162018 was 3.50%. A participant’s account is distributed to the employee six months after the participant’s separation from service. Deferred Compensation Plan The Deferred Compensation Plan is anon-qualified, unfunded plan that provides certain designated executives in the United States, including the NEOs, with the ability to defer taxation on up to 85% of their annual cash incentive awards. Deferrals may be invested in notional funds that generally mirror the PESP fund offerings, including shares of our Common Stock. | | | | | | | | 88 | | | | | Notice of Annual Meeting of Shareholders and 2019 Proxy Statement |
| | |
| | Executive Compensation | |
Post-Employment Compensation Arrangements While we have not entered into employment agreements with our executive officers, including the NEOs, they are eligible to receive certain payments and benefits in the event of a termination of employment, including following a change in control of the Company, under the Severance Plan and Change in Control Program. Mr. StrangfeldOur CEO does not participate in the Severance Plan. In the case of the NEOs, and in many cases subject to the approval of our Board, the various payments and benefits provided under the Severance Plan, the Change in Control Program, the Omnibus Plan and other Company programs, as applicable, are as follows: | | | | | | | | | | | | | | | | | | | | Severance | | Annual Incentives | | Stock Options | | Performance Shares/ Performance Units | | Book Value Units | | SERP | | Additional Retirement Accruals | | Health/Life | Voluntary Termination; Early or Normal Retirement | | — | | Annual Incentive Program | | Omnibus Plan* | | Omnibus
Plan* | | Omnibus Plan* | | — | | Merged Retirement Plan and Supplemental Retirement Plan | | — | Involuntary Termination Without Cause | | Severance Plan | | Annual Incentive Program | | Omnibus Plan** | | Omnibus Plan** | | Omnibus Plan** | | Prudential SERP | | Merged Retirement Plan and Supplemental Retirement Plan | | — | Separation in Connection Withwith Change in Control1 | | Change in Control Program | | Change in Control Program and Annual Incentive Program | | Change in Control Program and Omnibus Plan | | Change in Control Program
and Omnibus Plan | | Change in Control Program and Omnibus Plan | | Change in Control Program and Omnibus PlanPrudential SERP | | Prudential SERP | | Merged Retirement Plan and Supplemental Retirement Plan | | Change in Control Program | Separation
Due to
Disability | | — | | Annual Incentive Program | | Omnibus Plan | | Omnibus Plan | | Omnibus
Plan | | — | | Merged Retirement Plan and Supplemental Retirement Plan | | Prudential Welfare Benefits Plan | Separation Due to Death | | — | | Annual Incentive Program | | Omnibus Plan | | Omnibus
Plan | | Omnibus
Plan | | — | | Merged Retirement Plan and Supplemental Retirement Plan | | — |
See footnotes below. | | | | | | | | Notice of Annual Meeting of Shareholders and 20172019 Proxy Statement | | | | 73| | | 89 |
| | |
| | Executive Compensation | |
Voluntary Termination; Early or Normal Retirement SEVERANCE
ANNUAL INCENTIVES Annual Incentive Program: an annual incentive payment based on the current year’s business and individual performance, payable following the completion of the performance year. STOCK OPTIONS Omnibus Plan*Plan(1): (i) except for stock options granted on January 18, 2008, vestedVested stock options remain exercisable for a period of up to five years after termination; and unvested stock options continue to vest according to the original vesting schedule; and (ii) for stock options granted on January 18, 2008, (x) upon a voluntary termination of employment before January 18, 2012, unvested stock options are cancelled and vested stock options are exercisable for up to 90 days after termination, and (y) upon a voluntary termination of employment on or after January 18, 2012, unexercised stock options remain exercisable for a period of up to five years after termination.schedule. PERFORMANCE SHARES/PERFORMANCE UNITS Omnibus Plan*Plan(1): each grant of performance shares and performance units will be paid out at the end of its respective performance period based on the actual number of shares and performance units earned as determined by the Committee. Performance shares are paid in shares of Common Stock and performance units are paid in cash. BOOK VALUE UNITS Omnibus Plan*Plan(1): each grant of book value units vestsone-third each year and is paid out annually in cash based on the Company’s book value per share at the end of the fiscal quarter prior to payment. *(1) | Based on approved retirement treatment. However, in the event the participant does not qualify for approved retirement treatment (i) for stock options granted in 2005 or later, unvested stock options are cancelled and vested stock options are exercisable for up to 90 days after termination and (ii) all outstanding restricted stock units, performance shares, performance units and book value units are generally forfeited. |
SERP
ADDITIONAL RETIREMENT ACCRUALS Merged Retirement Plan and Supplemental Retirement Plan: additional benefit based on the annual incentive. HEALTH/LIFE
Involuntary Termination Without Cause SEVERANCE Severance Plan: assuming all eligibility conditions are satisfied, severance payments of up to 18 months of salary and annual incentive. ANNUAL INCENTIVES Annual Incentive Program: an annual incentive payment based on the current year’s business and individual performance, payable following the completion of the performance year. STOCK OPTIONS Omnibus Plan**Plan(2): (i) except for stock options granted on January 18, 2008, vestedVested stock options remain exercisable for a period of up to five years after termination date and unvested stock options continue to vest according to the original vesting schedule; and (ii) for stock options granted on January 18, 2008, unvested stock options arepro-rated and are exercisable for up to 90 days after termination.schedule. PERFORMANCE SHARES/PERFORMANCE UNITS Omnibus Plan**Plan(2): each grant of performance shares and performance units will be paid out at the end of its respective performance period based on the actual number of shares and performance units earned as determined by the Committee. Performance shares are paid in shares of Common Stock and performance units are paid in cash. BOOK VALUE UNITS Omnibus Plan**Plan(2): each grant of book value units vestsone-third each year and is paid out annually in cash based on the Company’s book value per share at the end of the fiscal quarter prior to payment. **(2) | Based on approved retirement treatment. However, in the event the participant does not qualify for approved retirement treatment (i) unvested stock options are cancelled and vested stock options are exercisable for up to 90 days after termination, (ii) for stock options granted on January 18, 2008, unvested stock options arepro-ratedand are exercisable for up to 90 days after termination, and (iii)(ii) generally apro-rata portion of restricted stock units, performance shares, performance units and book value units will vest. |
SERP Prudential SERP: Messrs. Falzon and PelletierSleyster are retirement- eligibleretirement-eligible and may receive an Early Retirement Benefit. ADDITIONAL RETIREMENT ACCRUALS Merged Retirement Plan and Supplemental Retirement Plan: additional benefit based on the annual incentive. Merged Retirement Plan (Traditional Pension Formula) and Supplemental Retirement Plan (Traditional Pension Formula): additional benefit to Mr. Pelletier based on the amount of severance paid and the period of time over which the severance is based (e.g., 78 weeks). Merged Retirement Plan (Cash Balance Formula) and Supplemental Retirement Plan (Cash Balance Formula): additional benefit to Messrs. Tanji, Falzon, Grier, and LowreySleyster based on the amount of severance. HEALTH/LIFE
Separation in Connection with Change in Control1(3) SEVERANCE Change in Control Program: (i) alump-sum payment equal to the sum of two times annual base salary and bonus (based on the average of the annual incentive payments for the previous three calendar years); and (ii) a payment equal to the present value of the retirement benefits that would have accrued during the period of time on which thelump-sum payment in (i) is based. (1)(3) | Pursuant to the Change in Control Program, before payments may be made, a change in control must have occurred and the designated executive officer’s employment must, within two years following the change in control, either have terminated involuntarily without “cause” or by the eligible executive officer for “good reason”.reason.” An eligible executive officer would have good reason to terminate his or her employment in the event of a material reduction in his or her compensation or the terms and conditions of his or her employment were to adversely change (for example, a reduction in job responsibilities, title, or forced relocation). |
ANNUAL INCENTIVES Change in Control Program and Annual Incentive Program: an annual incentive payment based on the target annual incentive award opportunity in the year termination occurs. | | | | | 74 | | | Notice of Annual Meeting of Shareholders and 2017 Proxy Statement |
| | | | | Executive Compensation
|
STOCK OPTIONS Change in Control Program and Omnibus Plan: accelerated vesting of stock options, only if outstanding awards will not be honored or assumed or substituted with equitable replacement awards made by a successor employer. PERFORMANCE SHARES/PERFORMANCE UNITS Change in Control Program and Omnibus Plan: payment of outstanding performance shares and performance units at target in cash or shares within 30 days of a change in control, only if outstanding awards will not be honored or assumed or substituted with equitable replacement awards made by a successor employer. For performance shares and performance units granted in 2017 and subsequent years, at the change in control (i) outstanding, unconverted performance shares and performance units will become vested at target and settled in cash or shares, as applicable, and (ii) outstanding performance shares and performance units that were converted to restricted stock units will become vested and settled in shares, only if such outstanding awards will not be honored or assumed or substituted with equitable replacement awards made by a successor employer. | | | | | | | | 90 | | | | | Notice of Annual Meeting of Shareholders and 2019 Proxy Statement |
| | |
| | Executive Compensation | |
BOOK VALUE UNITS Change in Control Program and Omnibus Plan: payment of outstanding book value units in cash based on the Company book value per share at the end of the fiscal quarter ended on or immediately prior to the change in control, only if outstanding awards will not be honored or assumed or substituted with equitable replacement awards made by a successor employer. SERP Prudential SERP: Messrs. Falzon and PelletierSleyster are retirement-eligible and may receive an Early Retirement Benefit. ADDITIONAL RETIREMENT ACCRUALS Merged Retirement Plan and Supplemental Retirement Plan: additional benefit based on the annual incentive. HEALTH/LIFE Change in Control Program: continued health benefits at active employee contribution levels for a period of 18 months, plus a “gross up” for any expected tax consequences associated with providing these health benefits. Separation Due to Disability SEVERANCE
ANNUAL INCENTIVES Annual Incentive Program: an annual incentive payment based on an average of the previous three years’ annual incentive awards. STOCK OPTIONS Omnibus Plan: stock option vesting accelerates with up to three years to exercise. PERFORMANCE SHARES/PERFORMANCE UNITS Omnibus Plan: all outstanding awards of performance shares and performance units are paid at target in shares of our Common Stock and cash, respectively. BOOK VALUE UNITS Omnibus Plan: all outstanding awards of book value units are paid out in cash based on the Company book value per share at the end of the fiscal quarter prior to payment. SERP
ADDITIONAL RETIREMENT ACCRUALS Merged Retirement Plan and Supplemental Retirement Plan: additional benefit based on the annual incentive. Merged Retirement Plan (Cash Balance Formula) and Supplemental Retirement Plan (Cash Balance Formula): Messrs. Lowrey, Tanji, Falzon, Grier, and LowreySleyster would receive additional credits until pension commencement (assumed to be Normal Retirement Date). HEALTH/LIFE Prudential Welfare Benefits Plan: monthly disability payment based on salary plus the greater of the most recently paid annual incentive award or the average of the last three most recently paid annual incentive awards. Separation Due to Death SEVERANCE
ANNUAL INCENTIVES Annual Incentive Program: an annual incentive payment based on an average of the previous three years’ annual incentive awards. STOCK OPTIONS Omnibus Plan: stock option vesting accelerates with a minimum of one and up to three years to exercise outstanding options. PERFORMANCE SHARES/PERFORMANCE UNITS Omnibus Plan: all outstanding awards of performance shares and performance units are paid at target in shares of our Common Stock and cash, respectively. BOOK VALUE UNITS Omnibus Plan: all outstanding awards of book value units are paid out in cash based on the Company book value per share at the end of the fiscal quarter prior to payment. SERP
ADDITIONAL RETIREMENT ACCRUALS Merged Retirement Plan and Supplemental Retirement Plan: additional benefit payable to the spouse based on the annual incentive. HEALTH/LIFE
| | | | | | | | Notice of Annual Meeting of Shareholders and 2019 Proxy Statement | | | | | 91 |
| | |
| | Executive Compensation | |
Potential Payments Uponupon Termination or Change in Control The following table presents, for each of the NEOs, the estimated payments and benefits that would have been payable as of the end of 20162018 in the event of: voluntary termination of employment; involuntary termination of employment without cause; separation due to a change in control of the Company; separation due to disability; and Consistent with SEC requirements, these estimated amounts have been calculated as if the NEO’s employment had been terminated as of December 30, 2016,31, 2018, the last business day of 2016,2018, and using the closing market price of our Common Stock on December 30, 201631, 2018 ($104.0681.55 per share). Retirement eligibility differs according to the employment separation event. The following table assumes that benefits are paid in an annuity form and commence on January 1, 2017,2019, unless stated otherwise. The table also assumes Board approval of various payments and Prudential SERP Early Retirement Benefits, as applicable, for all NEOs. | | | | | | | Notice of Annual Meeting of Shareholders and 2017 Proxy Statement | | | | 75 | |
| | | | | Executive Compensation
|
The following items have been excluded from the table: The benefits the NEOs would be entitled to receive under the SESP and the Deferred Compensation Plan (these benefits are disclosed in the Nonqualified Deferred Compensation Table contained in this Proxy Statement). Additional payments to the NEOs under the PESP, The Prudential Welfare Benefits Plan and The Prudential Retiree Welfare Benefits Plan (plans providing, among other things, life insurance, disability insurance, medical insurance and/or dental insurance), which do not discriminate in scope, terms, or operation in favor of the NEOs and are generally available to all salaried employees. The effects of an involuntary termination of employment for cause, which will result in a forfeiture of all outstanding vested and unvested performance shares, performance units, book value units, restricted stock units, and stock options, and for Mr. Pelletier, potential forfeiture of the benefit under the PSI SERP. The NEOs will receive no additional payments in the event of a termination of employment for cause. The amounts reported in the following table are hypothetical amounts based on the disclosure of compensation information about the NEOs. Actual payments and benefits will depend on the circumstances and timing of any termination of employment or other triggering event. Estimated Post-Employment Payments and Benefits | | | | | | | | | | | | | | | | | | | | | | | | | | | | | | Name | | Type of Payment or Benefit | | | Voluntary
Termination/Early or
Normal Retirement
($) | | | Involuntary
Termination
Without Cause
($) | | | Separation Due to
Change in Control
($) | | | Separation
Due to Disability
($) | | | Separation
Due to Death
($) | | | John R. Strangfeld | | | Severance Payment | | | | | | | | | | | | | | | | 21,462,445 | (1) | | | | | | | | | | | | Annual Incentive | | | | | | | | 5,976,000 | (2) | | | 5,976,000 | (2) | | | 6,000,000 | | | | 7,171,700 | | | | 7,171,700 | | | | | Long-term Incentive: | | | | Stock Options(3) | | | | | | | | | | | | | | | | | | | | | | | | | | | | | RSUs | | | | | | | | | | | | | | | | | | | | | | | | | | | | | Performance Shares(4) | | | | | | | | | | | | 10,556,159 | (4) | | | 10,556,159 | (4) | | | 10,556,159 | (4) | | | | | | | | Performance Units(5) | | | | | | | | | | | | 10,556,159 | (5) | | | 10,556,159 | (5) | | | 10,556,159 | (5) | | | | Book Value Performance | | | | Book Value Units(6) | | | | | | | | | | | | 9,106,014 | (6) | | | 9,106,014 | (6) | | | 9,106,014 | (6) | | | | Benefits: | | | | SERP | | | | | | | | | | | | | | | | | | | | | | | | | | | | | Health/Life | | | | | | | | | | | | 27,369 | (7) | | | | | | | | | | | | | | | | Addtl. Retire Accurals | | | | 47,904 | | | | 47,904 | | | | 89,340 | | | | 2,112,300 | | | | 1,056,660 | | | | | | Total | | | | | | | | 6,023,904 | | | | 6,023,904 | | | | 57,797,486 | | | | 39,502,332 | | | | 38,446,692 | | | Robert M. Falzon | | | Severance Payment | | | | | | | | | | | | 5,100,000 | | | | 7,850,324 | (1) | | | | | | | | | | | | Annual Incentive | | | | | | | | 2,990,000 | (2) | | | 2,990,000 | (2) | | | 3,000,000 | | | | 2,630,000 | | | | 2,630,000 | | | | | Long-term Incentive: | | | | Stock Options(3) | | | | | | | | | | | | | | | | | | | | | | | | | | | | | RSUs | | | | | | | | | | | | | | | | | | | | | | | | | | | | | Performance Shares(4) | | | | | | | | | | | | 3,787,888 | (4) | | | 3,787,888 | (4) | | | 3,787,888 | (4) | | | | | | | | Performance Units(5) | | | | | | | | | | | | 3,787,888 | (5) | | | 3,787,888 | (5) | | | 3,787,888 | (5) | | | | Book Value Performance | | | | Book Value Units(6) | | | | | | | | | | | | 3,477,905 | (6) | | | 3,477,905 | (6) | | | 3,477,905 | (6) | | | | Benefits: | | | | SERP | | | | | | | | 118,620 | | | | 118,620 | | | | | | | | | | | | | | | | | Health/Life | | | | | | | | | | | | 27,369 | (7) | | | | | | | | | | | | | | | | Addtl. Retire Accurals | | | | 320,068 | | | | 866,004 | | | | 321,139 | | | | 2,962,251 | | | | 284,040 | | | | | | Total | | | | | | | | 3,310,068 | | | | 9,074,624 | | | | 22,371,134 | | | | 16,645,933 | | | | 13,967,722 | | | Mark B. Grier | | | Severance Payment | | | | | | | | | | | | 10,835,100 | | | | 18,376,355 | (1) | | | | | | | | | | | | Annual Incentive | | | | | | | | 5,080,000 | (2) | | | 5,080,000 | (2) | | | 5,100,000 | | | | 6,033,400 | | | | 6,033,400 | | | | | Long-term Incentive: | | | | Stock Options(3) | | | | | | | | | | | | | | | | | | | | | | | | | | | | | RSUs | | | | | | | | | | | | | | | | | | | | | | | | | | | | | Performance Shares(4) | | | | | | | | | | | | 8,591,610 | (4) | | | 8,591,610 | (4) | | | 8,591,610 | (4) | | | | | | | | Performance Units(5) | | | | | | | | | | | | 8,591,610 | (5) | | | 8,591,610 | (5) | | | 8,591,610 | (5) | | | | Book Value Performance | | | | Book Value Units(6) | | | | | | | | | | | | 7,551,015 | (6) | | | 7,551,015 | (6) | | | 7,551,015 | (6) | | | | Benefits: | | | | SERP | | | | | | | | | | | | | | | | | | | | | | | | | | | | | Health/Life | | | | | | | | | | | | 33,072 | (7) | | | 394,678 | | | | | | | | | | | | | Addtl. Retire Accurals | | | | 697,097 | | | | 2,183,928 | | | | 699,841 | | | | 1,554,473 | | | | 832,609 | | | | | | Total | | | | | | | | 5,777,097 | | | | 18,099,028 | | | | 48,943,503 | | | | 32,716,786 | | | | 31,600,244 | | | Charles F. Lowrey | | | Severance Payment | | | | | | | | | | | | 8,780,100 | | | | 13,512,271 | (1) | | | | | | | | | | | | Annual Incentive | | | | | | | | 3,985,000 | (2) | | | 3,985,000 | (2) | | | 4,000,000 | | | | 5,083,400 | | | | 5,083,400 | | | | | Long-term Incentive: | | | | Stock Options(3) | | | | | | | | | | | | | | | | | | | | | | | | | | | | | RSUs | | | | | | | | | | | | | | | | | | | | | | | | | | | | | Performance Shares(4) | | | | | | | | | | | | 5,353,367 | (4) | | | 5,353,367 | (4) | | | 5,353,367 | (4) | | | | | | | | Performance Units(5) | | | | | | | | | | | | 5,353,367 | (5) | | | 5,353,367 | (5) | | | 5,353,367 | (5) | | | | Book Value Performance | | | | Book Value Units(6) | | | | | | | | | | | | 5,567,475 | (6) | | | 5,567,475 | (6) | | | 5,567,475 | (6) | | | | Benefits: | | | | SERP | | | | | | | | | | | | | | | | | | | | | | | | | | | | | Health/Life | | | | | | | | | | | | 33,207 | (7) | | | | | | | | | | | | | | | | Addtl. Retire Accurals | | | | 418,930 | | | | 1,341,953 | | | | 420,508 | | | | 4,453,070 | | | | 538,840 | | | | | | Total | | | | | | | | 4,403,930 | | | | 14,107,053 | | | | 34,240,195 | | | | 25,810,679 | | | | 21,896,449 | | | Stephen Pelletier | | | Severance Payment | | | | | | | | | | | | 6,280,050 | | | | 12,201,885 | (1) | | | | | | | | | | | | Annual Incentive | | | | | | | | 3,985,000 | (2) | | | 3,985,000 | (2) | | | 4,000,000 | | | | 3,416,700 | | | | 3,416,700 | | | | | Long-term Incentive: | | | | Stock Options(3) | | | | | | | | | | | | | | | | | | | | | | | | | | | | | RSUs | | | | | | | | | | | | | | | | | | | | | | | | | | | | | Performance Shares(4) | | | | | | | | | | | | 4,540,866 | (4) | | | 4,540,866 | (4) | | | 4,540,866 | (4) | | | | | | | | Performance Units(5) | | | | | | | | | | | | 4,540,866 | (5) | | | 4,540,866 | (5) | | | 4,540,866 | (5) | | | | Book Value Performance | | | | Book Value Units(6) | | | | | | | | | | | | 4,018,476 | (6) | | | 4,018,476 | (6) | | | 4,018,476 | (6) | | | | Benefits: | | | | SERP | | | | | | | | 274,380 | | | | 1,446,516 | | | | | | | | | | | | | | | | | Health/Life | | | | | | | | | | | | 31,729 | (7) | | | | | | | | | | | | | | | | Addtl. Retire Accurals | | | | 1,990,500 | | | | 5,500,164 | | | | 2,010,048 | | | | 1,457,004 | | | | 802,104 | | | | | | Total | | | | | | | | 5,975,500 | | | | 16,039,594 | | | | 32,790,386 | | | | 17,973,912 | | | | 17,319,012 | |
| | | | | | | | | | | | | | | | | | | | | | | | | | Name | | Type of Payment or Benefit | | | | Voluntary
Termination/Early or
Normal Retirement
($) | | | Involuntary
Termination
Without Cause
($) | | | Separation Due to
Change in Control
($) | | | Separation Due to
Disability ($) | | | Separation
Due to Death
($) | | | | | Charles F. Lowrey | | Severance Payment | | | | | | | | | | | | | 13,095,920(1) | | | | | | | | | | | | | | | | Annual Incentive | | | | | 4,100,000(2) | | | | 4,100,0000(2) | | | | 5,000,000 | | | | 4,225,000 | | | | 4,225,000 | | | | | | | | Long-term Incentive: | | Stock Options(3) | | | | | | | | | | | | | | | | | | | | | | | | | RSUs | | | | | | | | | | | | | | | | | | | | | | | | | Performance Shares(4) | | | | | | | | | | | 3,723,165(4) | | | | 3,723,165(4) | | | | 3,723,165 | (4) | | | | | Performance Units(5) | | | | | | | | | | | 3,723,165(5) | | | | 3,723,165(5) | | | | 3,723,165 | (5) | | | Book Value Performance | | Book Value Units(6) | | | | | | | | | | | 5,116,665(6) | | | | 5,116,665(6) | | | | 5,116,665 | (6) | | | | | | | Benefits: | | SERP | | | | | | | | | | | | | | | | | | | | | | | | | Health/Life | | | | | | | | | | | 40,143(7) | | | | | | | | | | | | | | Addtl. Retire Accurals | | | 475,600 | | | | 475,600 | | | | 580,000 | | | | 3,208,568 | | | | 490,100 | | | | | | | | Total | | | | | 4,575,600 | | | | 4,575,600 | | | | 31,279,058 | | | | 19,996,563 | | | | 17,278,095 | | | | | John R. Strangfeld | | Severance Payment | | | | | | | | | | | | | | | | | | | | | | | | | | | | | Annual Incentive | | | | | | | | | | | | | | | | | | | | | | | | | | | | | Long-term Incentive: | | Stock Options(3)
RSUs | | | | | | | | | | | | | | | | | | | | | | | | | Performance Shares(4) | | | | | | | | | | | 10,224,657(4) | | | | 10,224,657(4) | | | | 10,224,657 | (4) | | | | | Performance Units(5) | | | | | | | | | | | 10,224,657(5) | | | | 10,224,657(5) | | | | 10,224,657 | (5) | | | Book Value Performance | | Book Value Units(6) | | | | | | | | | | | 10,888,761(6) | | | | 10,888,761(6) | | | | 10,888,761 | (6) | | | | | | | Benefits: | | SERP | | | | | | | | | | | | | | | | | | | | | | | | | Health/Life | | | | | | | | | | | | | | | | | | | | | | | | | Addtl. Retire Accurals | | | | | | | | | | | | | | | | | | | | | | | | | | | Total | | | | | - | | | | - | | | | 31,338,075 | | | | 31,338,075 | | | | 31,338,075 | | | | | |
1 | | | | | | | | 92 | | | | | Notice of Annual Meeting of Shareholders and 2019 Proxy Statement |
| | |
| | Executive Compensation | |
| | | | | | | | | | | | | | | | | | | | | | | | | | Name | | Type of Payment or Benefit | | | | Voluntary
Termination/Early or
Normal Retirement
($) | | | Involuntary
Termination
Without Cause
($) | | | Separation Due to
Change in Control
($) | | | Separation Due to
Disability ($) | | | Separation
Due to Death
($) | | | | | Kenneth Y. Tanji | | Severance Payment | | | | | | | | | 2,442,600 | | | | 3,530,628(1) | | | | | | | | | | | | | | | | Annual Incentive | | | | | 1,100,000(2) | | | | 1,100,000(2) | | | | 1,800,000 | | | | 1,028,400 | | | | 1,028,400 | | | | | | | | Long-term Incentive: | | Stock Options(3) | | | | | | | | | | | | | | | | | | | | | | | | | RSUs | | | | | | | | | | | | | | | | | | | | | | | | | Performance Shares(4) | | | | | | | | | | | 551,033(4) | | | | 551,033(4) | | | | 551,033 | (4) | | | | | Performance Units(5) | | | | | | | | | | | 551,033(5) | | | | 551,033(5) | | | | 551,033 | (5) | | | Book Value Performance | | Book Value Units(6) | | | | | | | | | | | 702,433(6) | | | | 702,433(6) | | | | 702,433 | (6) | | | | | | | Benefits: | | SERP | | | | | | | | | | | | | | | | | | | | | | | | | Health/Life | | | | | | | | | | | 38,088(7) | | | | 1,649,436 | | | | | | | | | | Addtl. Retire Accurals | | | 99,000 | | | | 318,834 | | | | 162,000 | | | | 1,948,399 | | | | 92,556 | | | | | | | | Total | | | | | 1,199,000 | | | | 3,861,434 | | | | 7,335,215 | | | | 6,430,734 | | | | 2,925,455 | | | | | Robert M. Falzon | | Severance Payment | | | | | | | | | 5,960,100 | | | | 9,462,577(1) | | | | | | | | | | | | | | | | Annual Incentive | | | | | 3,070,000(2) | | | | 3,070,000(2) | | | | 4,000,000 | | | | 2,973,400 | | | | 2,973,400 | | | | | | | | Long-term Incentive: | | Stock Options(3) | | | | | | | | | | | | | | | | | | | | | | | | | RSUs | | | | | | | | | | | | | | | | | | | | | | | | | Performance Shares(4) | | | | | | | | | | | 3,086,504(4) | | | | 3,086,504(4) | | | | 3,086,504 | (4) | | | | | Performance Units(5) | | | | | | | | | | | 3,086,504(5) | | | | 3,086,504(5) | | | | 3,086,504 | (5) | | | Book Value Performance | | Book Value Units(6) | | | | | | | | | | | 3,934,906(6) | | | | 3,934,906(6) | | | | 3,934,906 | (6) | | | | | | | Benefits: | | SERP | | | | | | | 18,166 | | | | 18,166 | | | | | | | | | | | | | | Health/Life | | | | | | | | | | | 27,513(7) | | | | | | | | | | | | | | Addtl. Retire Accurals | | | 326,967 | | | | 961,694 | | | | 425,995 | | | | 2,969,023 | | | | 347,888 | | | | | | | | Total | | | | | 3,396,967 | | | | 10,009,960 | | | | 24,042,165 | | | | 16,050,337 | | | | 13,429,202 | | | | | Mark B. Grier | | Severance Payment | | | | | | | | | 9,705,000 | | | | 15,038,611(1) | | | | | | | | | | | | | | | | Annual Incentive | | | | | 5,200,000(2) | | | | 5,200,000(2) | | | | 5,100,000 | | | | 5,280,000 | | | | 5,280,000 | | | | | | | | Long-term Incentive: | | Stock Options(3) | | | | | | | | | | | | | | | | | | | | | | | | | RSUs | | | | | | | | | | | | | | | | | | | | | | | | | Performance Shares(4) | | | | | | | | | | | 6,172,927(4) | | | | 6,172,927(4) | | | | 6,172,927 | (4) | | | | | Performance Units(5) | | | | | | | | | | | 6,172,927(4) | | | | 6,172,927(4) | | | | 6,172,927 | (4) | | | Book Value Performance | | Book Value Units(6) | | | | | | | | | | | 7,320,727(4) | | | | 7,320,727(4) | | | | 7,320,727 | (4) | | | | | | | Benefits: | | SERP | | | | | | | | | | | | | | | | | | | | | | | | | Health/Life | | | | | | | | | | | 39,109(7) | | | | 88,553 | | | | | | | | | | Addtl. Retire Accurals | | | 728,000 | | | | 2,086,700 | | | | 714,000 | | | | 739,200 | | | | 739,200 | | | | | | | | Total | | | | | 5,928,000 | | | | 16,991,700 | | | | 40,558,301 | | | | 25,774,334 | | | | 25,685,781 | | | | | Stephen Pelletier | | Severance Payment | | | | | | | | | 6,347,550 | | | | 17,568,232(1) | | | | | | | | | | | | | | | | Annual Incentive | | | | | 4,100,000(2) | | | | 4,100,000(2) | | | | 4,000,000 | | | | 3,961,700 | | | | 3,961,700 | | | | | | | | Long-term Incentive: | | Stock Options(3) | | | | | | | | | | | | | | | | | | | | | | | | | RSUs | | | | | | | | | | | | | | | | | | | | | | | | | Performance Shares(4) | | | | | | | | | | | 3,522,471(4) | | | | 3,522,471(4) | | | | 3,522,471 | (4) | | | | | Performance Units(5) | | | | | | | | | | | 3,522,471(5) | | | | 3,522,471(5) | | | | 3,522,471 | (5) | | | Book Value Performance | | Book Value Units(6) | | | | | | | | | | | 4,971,553(6) | | | | 4,971,553(6) | | | | 4,971,553 | (6) | | | | | | | Benefits: | | SERP | | | | | | | | | | | | | | | | | | | | | | | | | Health/Life | | | | | | | | | | | 36,310(7) | | | | | | | | | | | | | | Addtl. Retire Accurals | | | 864,313 | | | | 3,336,720 | | | | 751,531 | | | | 708,335 | | | | 354,168 | | | | | | | | Total | | | | | 4,964,313 | | | | 13,784,270 | | | | 34,372,568 | | | | 16,686,530 | | | | 16,332,363 | | | | | Scott G. Sleyster | | Severance Payment | | | | | | | | | 3,660,000 | | | | 5,725,546(1) | | | | | | | | | | | | | | | | Annual Incentive | | | | | 1,800,000(2) | | | | 1,800,000(2) | | | | 2,500,000 | | | | 1,740,000 | | | | 1,740,000 | | | | | | | | Long-term Incentive: | | Stock Options(3) | | | | | | | | | | | | | | | | | | | | | | | | | RSUs | | | | | | | | | | | | | | | | | | | | | | | | | Performance Shares(4) | | | | | | | | | | | 2,086,538(4) | | | | 2,086,538(4) | | | | 2,086,538 | (4) | | | | | Performance Units(5) | | | | | | | | | | | 2,086,538(5) | | | | 2,086,538(5) | | | | 2,086,538 | (5) | | | Book Value Performance | | Book Value Units(6) | | | | | | | | | | | 2,206,445(6) | | | | 2,206,445(6) | | | | 2,206,445 | (6) | | | | | | | Benefits: | | SERP | | | | | | | 192,232 | | | | 192,232 | | | | | | | | | | | | | | Health/Life | | | | | | | | | | | 34,790(7) | | | | 1,107,268 | | | | | | | | | | Addtl. Retire Accurals | | | 179,830 | | | | 545,312 | | | | 249,685 | | | | 1,806,639 | | | | 191,400 | | | | | | | | Total | | | | | 1,979,830 | | | | 6,197,544 | | | | 15,081,774 | | | | 11,033,428 | | | | 8,310,921 | | | |
| (1) | Includes severance payments equal to two times annual cash compensation (subject to execution of a non-competition agreement), and a cash payment for the pension impact of additional two years of credited service. |
2(2) | Includes annual incentive award amount for 20162018 performance. |
3(3) | For disability and death, accelerated vesting of all stock options with up to three years to exercise. |
4(4) | Includes the value of 2016, 2015,2017, and 20142018 target performance shares paid based on the closing market price of our Common Stock on December 31, 20162017 ($104.0681.55 per share). |
5(5) | Includes the value of 2016, 2015,2017, and 20142018 target performance units paid based on the closing market price of our Common Stock on December 31, 20162017 ($104.0681.55 per share). |
6(6) | Includes the value of 2016, 2015,2017, and 20142018 book value units paid based on the Company’s book value per share as of December 31, 20162018 ($78.9596.06 per share)share for awards granted in 2018, $92.01 per share for awards granted prior to 2018). |
7(7) | Reflects the expected contribution subsidy for 18 months and the associated tax gross-up. For this purpose, we have assumed the 20172019 premium and contribution rates continue for the full 18 months. |
| | | | | 76 | | | | Notice of Annual Meeting of Shareholders and 20172019 Proxy Statement | | | | | 93 |
General Information About The Meeting Voting Instructions and Information Who Can Vote You are entitled to vote your Common Stock if our records show that you held your shares as of the record date of March 10, 2017.15, 2019. At the close of business on that date, a total of 430,370,040408,333,715 shares of Common Stock were outstanding and entitled to vote. Each share of Common Stock is entitled to one vote at this Annual Meeting. Your voting instructions are confidential and will not be disclosed to persons other than those recording the vote, except if a shareholder makesyou make a written comment on the proxy card, otherwise communicates his or hercommunicate your vote to management, as may be required in accordance with the appropriate legal process, or as authorized by you. Voting Your Proxy If your Common Stock is held through a broker, bank or other nominee (held in street name), you will receive instructions from such entity that you must follow in order to have your shares voted. If you want to vote in person, you must obtain a legal proxy from your broker, bank or other nominee, and bring it to the meeting, and submit it with your vote. If you hold your shares in your own name as a holder of record with our transfer agent, Computershare, you may instruct the proxies how to vote by following the instructions listed on the Notice of Internet Availability or the proxy card to vote online, or by signing, dating and mailing the proxy card in the postage-paid envelope. Of course, you can always come to the meeting and vote your shares in person. Whichever method you select to transmit your instructions, the proxies will vote your shares in accordance with those instructions. Except as discussed below with respect to shares held in certain companyCompany plans, if you sign and return a proxy card without giving specific voting instructions, your shares will be voted as recommended by the Board of Directors: FOR each director nominee, FOR ratification of the appointment of the independent registered public accounting firm,auditor, FOR the advisory vote to approve named executive officer compensation, for “EVERY YEAR” on the advisory vote on the frequency of future advisory votes to approve named executive officer compensation, and AGAINST the shareholder proposal regarding an independent Board Chairman.the Right to Act by Written Consent. Special Voting Instructions for Plan Shares If you are a participant in The Prudential Employee Savings Plan (“PESP”) and your account is invested in the PFI Common Stock Fund, you may instruct the PESP Trustee how to vote the shares of Common Stock credited to your PESP account and held in the Fund on March 7, 2017.13, 2019. The PESP Trustee, the shareholder of record, will vote these shares in accordance with your instructions or, if you do not provide voting instructions, in the same proportion as the PESP Trustee votes the shares for which it received timely voting instructions subject to the terms of the PESP plan document, its trust agreement and applicable law. If you hold shares of Common Stock through your participation in the international portion of the Prudential Stock Purchase Plan, the Prudential International Stock Purchase Plan, or the international portion of the Associates Grants (including(covering vested shares of Prudential Financial, Inc. Common Stock) under the Prudential Financial, Inc. Omnibus Incentive Plan (collectively, “the Plan”the “Plan”), on March 15, 2019, those shares will be voted by the Plan administrator in accordance with your instructions or, if you do not provide voting instructions, in accordance with the Board of Directors’ recommendation subject to the terms of the Plan and applicable law. Matters to Bebe Presented We are not aware of any matters to be presented at the Annual Meeting other than those described in this Proxy Statement. If any matters not described in this Proxy Statement are properly presented at the meeting, the proxies will use their own judgment to determine how to vote your shares. If the meeting is adjourned or postponed, the proxies can vote your shares at the adjournment or postponement as well. Revoking Your Proxy If you hold your shares in street name, you must follow the instructions of your broker, bank or other nominee to revoke your voting instructions. If you are a holder of record and wish to revoke your proxy instructions, you must deliver later-dated proxy | | | | | | | | 94 | | | | | Notice of Annual Meeting of Shareholders and 2019 Proxy Statement |
| | |
| | General Information About The Meeting | |
instructions, advise the Chief Governance Officer and Corporate Secretary in writing before the proxies vote your shares at the meeting,Annual Meeting, or attend the meetingAnnual Meeting and vote your shares in person. | | | | | | | Notice of Annual Meeting of Shareholders and 2017 Proxy Statement | | | | 77 | |
| | | | | General Information About The Meeting
|
Quorum A quorum is required to transact business at our Annual Meeting. Shareholders of record holding shares of stock constituting 50% of the shares entitled to be cast shall constitute a quorum. If you have returned valid proxy instructions or attend the meeting in person, your shares will be counted for the purpose of determining whether there is a quorum, even if you abstain from voting on some or all matters introduced at the meeting. In addition, brokernon-votes will be treated as present for purposes of determining whether a quorum is present. Voting Requirements You may either vote for, against or abstain on each of the proposals, with the exception of Item 4 where you may vote for one year, two years, three years or abstain.proposals. The affirmative vote of a majority of the votes cast is required to approve each proposal. Brokernon-votes and abstentions will have no impact, as they are not counted as votes cast. Although the advisory votesvote in ItemsItem 3 and 4 areisnon-binding, as provided by law, our Board will review the results of the votesvote and, consistent with our commitment to shareholder engagement, will take themthe results into account in making a determination concerning our named executive officer compensation and the frequency of future advisory votes to approve named executive officer compensation. If you hold your shares in street name, and you do not submit voting instructions to your broker, bank or other nominee, your broker, bank or other nominee will not be permitted to vote your shares in their discretion on the election of directors, the advisory vote to approve executive compensation, the advisory vote on the frequency of future advisory votes to approve named executive officer compensation, or the shareholder proposal regarding an independent Board Chairman,the right to act by written consent, but may still be permitted to vote your shares in their discretion on the ratification of the independent registered public accounting firm.auditor. Election of Directors At the meeting, each nominee must receive the affirmative vote of a majority of the votes cast with respect to his or her election in order to be elected. If an incumbent nominee is not elected by the requisite vote, he or she must tender his or her resignation, and the Board, through a process managed by the Corporate Governance and Business Ethics Committee, will decide whether to accept the resignation. BOARD RECOMMENDATIONS The Board of Directors recommends that you vote“FOR” each of the Director Nominees,“FOR” the ratification of the appointment of the Independent Registered Public Accounting Firm,Auditor, “FOR” the advisory vote to approve named executive officer compensation for“EVERY YEAR” on the advisory vote on the frequency of future advisory votes to approve named executive officer compensation and“AGAINST” the shareholder proposal regarding an independent Board Chairman.the Right to Act by Written Consent Cost of Proxy Solicitation We are providing these proxy materials in connection with the solicitation by the Company’s Board of Directors of proxies to be voted at our Annual Meeting. We will pay the cost of this proxy solicitation. In addition to soliciting proxies by mail, we expect that a number of our employees will solicit shareholders personally, electronically and by telephone. None of these employees will receive any additional compensation for doing this. We have retained Georgeson, Inc. to assist in the solicitation of proxies for a fee of $25,000 plus reimbursement of expenses. We will, on request, reimburse brokers, banks and other nominees for their expenses in sending proxy materials to their customers who are beneficial owners and obtaining their voting instructions. Attending the Annual Meeting If you attend the Annual Meeting, you will be asked to present valid, government-issued photo identification, such as a driver’s license. If you are a holder of record, the top half of your proxy card or your Notice of Internet Availability is your admission ticket. If you hold your shares in street name, you will need proof of ownership to be admitted to the meeting. A recent brokerage | | | | | | | | Notice of Annual Meeting of Shareholders and 2019 Proxy Statement | | | | | 95 |
| | |
| | General Information About The Meeting | |
statement or a letter from your bank or broker are examples of proof of ownership. If you want to vote your shares held in street name in person, you must get a legal proxy in your name from the broker, bank or other nominee that holds your shares, and submit it with your vote. | | | | | 78 | | | Notice of Annual Meeting of Shareholders and 2017 Proxy Statement |
| | | | | General Information About The Meeting
|
Attendance at the Annual Meeting is limited to shareholders of Prudential as of the record date. Each shareholder may appoint only one proxy holder or representative to attend the Annual Meeting on his or her behalf. Submission of Shareholder Proposals and Director Nominations Proposals and Director Nominations for Inclusion in the Proxy Statement for the 20182020 Annual Meeting In order to submit shareholder proposals for the 20182020 Annual Meeting of Shareholders for inclusion in our Proxy Statement pursuant to SEC Rule14a-8, materials must be received by the Chief Governance Officer and Corporate Secretary at the Company’s principal office in Newark, New Jersey,NJ (see below), no later than the close of business on November 21, 2017.29, 2019. We have adopted proxy access, which permits a shareholder, or a group of up to 20 shareholders, owning 3% or more of the Company’s outstanding capital stock for at least three years, to submit director nominees for up to 20% of the Board for inclusion in our Proxy Statement if the shareholder(s) and the nominee(s) meet the requirements in ourBy-laws. Notice of director nominations submitted under these proxy accessBy-law provisions must be received no earlier than December 10, 201716, 2019 and no later than January 9, 2018.15, 2020. However, if the 20182020 Annual Meeting is more than 30 days before or after the first anniversary of the date of this year’s Annual Meeting, such notice must be received no later than the close of business on the 10th day following the earlier of the day on which notice of the date of the 20172020 Annual Meeting was mailed or public disclosure of the meeting date was made. Proposals submitted for inclusion in our Proxy Statement must comply with all of the requirements of SEC Rule14a-8, and director nominations submitted pursuant to the proxy access provisions of ourBy-laws must comply with all of the requirements of ourBy-laws.By-laws, a copy of which may be obtained at no cost from the Chief Governance Officer and Corporate Secretary. As the rules of the SEC and ourBy-laws make clear, simply submitting a proposal or nomination does not guarantee its inclusion. Other Proposals or Director Nominations for Presentation at the 20182020 Annual Meeting OurBy-laws also establish an advance notice procedure with regard to director nominations and shareholder proposals that are not submitted for inclusion in the Proxy Statement, but that a shareholder instead wishes to present directly at an Annual Meeting. To be properly brought before the 20182020 Annual Meeting, a notice of the nomination or the matter the shareholder wishes to present at the meeting must be delivered to the Chief Governance Officer and Corporate Secretary at the Company’s principal office in Newark (see below) not less than 120 or more than 150 days prior to the first anniversary of the date of this year’s Annual Meeting. As a result, any notice given by or on behalf of a shareholder pursuant to these provisions of the Company’sBy-laws (and not pursuant to SEC Rule14a-8) must be received no earlier than December 10, 201716, 2019 and no later than January 9, 2018.15, 2020. However, if the 20182020 Annual Meeting is more than 30 days before or after the first anniversary of the date of this year’s Annual Meeting, such notice must be received no later than the close of business on the 10th day following the earlier of the day on which notice of the date of the 20182020 Annual Meeting was mailed or public disclosure of the meeting date was made. All director nominations and shareholder proposals must comply with the requirements of the Company’sBy-laws,By-laws. a copy of which may be obtained at no cost from the Chief Governance Officer and Corporate Secretary. The Chairman may refuse to acknowledge or introduce any such matter at the 2020 Annual Meeting if notice of the matter is not received within the applicable deadlines or does not comply with the Company’sBy-laws. If a shareholder does not meet these deadlines, or does not satisfy the requirements of Rule14a-4 of the Exchange Act, the persons named as proxies will be allowed to use their discretionary voting authority when and if the matter is raised at the 2020 Annual Meeting. All proposals and director nominations should be addressed to: Margaret M. Foran, Chief Governance Officer, Senior Vice President and Corporate Secretary, Prudential Financial, Inc., 751 Broad Street, Newark, NJ 07102. Eliminating Duplicative Proxy Materials A single Proxy Statement and Annual Report, along with individual proxy cards, or individual Notices of Internet Availability, will be delivered in one envelope to multiple shareholders having the same last name and address and to individuals with more than one account registered at Computershare with the same address unless contrary instructions have been received from an affected shareholder. | | | | | | | | 96 | | | | | Notice of Annual Meeting of Shareholders and 2019 Proxy Statement |
| | |
| | General Information About The Meeting | |
If you would like to enroll in this service or receive individual copies of all documents, now or in the future, please contact Computershare by calling1-800-305-9404 or writing Computershare, P.O. Box 43033, Providence, RI 02940-3033. We will | | | | | | | Notice of Annual Meeting of Shareholders and 2017 Proxy Statement | | | | 79 | |
| | | | | General Information About The Meeting
|
deliver a separate copy of all documents to a shareholder at a shared address to which a single copy of the documents was delivered promptly upon request to the address or telephone number provided above. Delivery of Proxy Materials We want to communicate with you in the way that is most convenient for you. You may choose to receive either a full set of printed materials—which will include an Annual Report, Proxy Statement, and proxy card—or an email with instructions for how to view the materials and vote online. To select a method of delivery during the voting season, registered shareholders may follow the instructions when voting online at www.investorvote.com/prudential. Following the 20172019 Annual Meeting, you may continue to choose your method of delivery of future documents by visiting www.computershare.com/investor. If you own shares indirectly through a broker, bank, or other nominee, please contact your financial institution for additional information regarding delivery options. If you do not choose a method of delivery as outlined above, you may receive aone-page Notice of Internet Availability instructing you how to access the materials and vote online in lieu of printed or electronic materials. As a publicly traded company, Prudential is legally required to make these materials available to all shareholders, and it is not possible to opt out of the mailing. Important Notice Regarding the Availability of Proxy Materials for the 20172019 Annual Meeting of Shareholders to Be Held on May 9, 2017:14, 2019: Our 20172019 Proxy Statement and Annual Report for the year ended December 31, 2016,2018, are available free of charge on our website at www.prudential.com/governance. Annual Report on Form10-K The Company will provide by mail, without charge, a copy of its Annual Report on Form10-K, at your request. Please direct all inquiries to the Company’s Corporate Information Service at1-877-998-ROCK (7625)investor.relations@prudential.com or 751 Broad Street, Newark, NJ 07102. Incorporation Byby Reference To the extent that this Proxy Statement has been or will be specifically incorporated by reference into any other filing of Prudential Financial under the Securities Act of 1933 or the Exchange Act, the sections of this Proxy Statement entitled “Report of the Audit Committee” (to the extent permitted by the rules of the SEC) and “Compensation Committee Report” shall not be deemed to be so incorporated, unless specifically provided otherwise in such filing. Shareholder List A list of shareholders entitled to vote at the Annual Meeting will be available for examination by shareholders at the Annual Meeting. | | | | | 80 | | | | Notice of Annual Meeting of Shareholders and 20172019 Proxy Statement | | | | | 97 |
AppendixAPPENDIX A -Non-GAAP Measures
Adjusted operating income (“AOI”) and operating return on average equity arenon-GAAP measures of financial performance. Adjusted book value is anon-GAAP measure of financial position. We use earnings per share based on AOI, operating return on average equity, and adjusted book value as performance measures in our incentive compensation programs. Also, we believe that our use of thesenon-GAAP measures helps investors understand and evaluate the Company’s results of operations and financial position by providing measures that are primarily attributable to our business operations separate from the portion attributable to external and potentially volatile capital and currency market conditions. Adjusted Operating Income Adjusted operating income excludes “Realized investment gains (losses), net,” as adjusted, and related charges and adjustments. A significant element of realized investment gains and losses are impairments and credit-related and interest rate-related gains and losses. Impairments and losses from sales of credit-impaired securities, the timing of which depends largely on market credit cycles, can vary considerably across periods. The timing of other sales that would result in gains or losses, such as interest rate-related gains or losses, is largely subject to our discretion and influenced by market opportunities as well as our tax and capital profile. Realized investment gains (losses) within certain of our businesses for which such gains (losses) are a principal source of earnings, and those associated with terminating hedges of foreign currency earnings and current period yield adjustments are included in adjusted operating income. Adjusted operating income generally excludes realized investment gains and losses from products that contain embedded derivatives, and from associated derivative portfolios that are part of an asset-liabilityasset/liability management program related to the risk of those products. However, the effectiveness of our hedging program will ultimately be reflected in adjusted operating income over time. Adjusted operating income also excludes gains and losses from changes in value of certain assets and liabilities relating to foreign currency exchange movements that have been economically hedged or considered part of our capital funding strategies for our international subsidiaries, as well as gains and losses on certain investments that are classifieddesignated as other trading account assets.trading. Additionally, adjusted operating income excludes the changes in fair value of equity securities that are recorded in net income beginning on January 1, 2018 as a result of the adoption of ASU2016-01. Adjusted operating income also excludes investment gains and losses on trading account assets supporting insuranceexperience-rated contractholder liabilities and changes in experience-rated contractholder liabilities due to asset value changes, because these recorded changes in asset and liability values are expected to ultimately accrue to contractholders. In addition, adjusted operating income excludes the results of divested andrun-offbusinesses, which are not relevant to our ongoing operations. Discontinued operations and earningsEarnings attributable to noncontrolling interests, each of which is presented as a separate component of net income under GAAP, are also excluded from adjusted operating income. The tax effect associated withpre-tax adjusted operating income is based on applicable IRSInternal Revenue Service and foreign tax regulations inclusive of pertinent adjustments. | | | | | | | | 98 | | | | | Notice of Annual Meeting of Shareholders and 20172019 Proxy Statement | | | | 81 | |
| | |
| | Appendix A | |
ReconciliationsReconciliation of GAAP Net Income toAfter-Tax Adjusted Operating Income
(in billions) | | | | | | | | | | | | Year Ended
December 31 | | | | | 2016 | | | 2015 | | | Net income attributable to Prudential Financial, Inc. | | $ | 4.37 | | | $ | 5.64 | | | Income attributable to noncontrolling interests | | $ | 0.05 | | | $ | 0.07 | | | Net income | | $ | 4.42 | | | $ | 5.71 | | | Less: Income from discontinued operations, net of taxes | | $ | — | | | $ | — | | | Income from continuing operations (after-tax) | | $ | 4.42 | | | $ | 5.71 | | | Less: Earnings attributable to noncontrolling interests | | $ | 0.05 | | | $ | 0.07 | | | Income from continuing operations attributable to Prudential Financial, Inc. | | $ | 4.37 | | | $ | 5.64 | | | Less: Equity in earnings of operating joint ventures, net of taxes and earnings attributable to noncontrolling interests | | $ | (0.00 | ) | | $ | (0.06 | ) | | Income from continuing operations (after-tax) before equity in earnings ofoperating joint ventures | | $ | 4.37 | | | $ | 5.70 | | Less: Reconciling Items: | | | | | | | | | Realized investment gains (losses), net, and related charges and adjustments | | $ | 0.52 | | | $ | 1.58 | | Investment losses on trading account assets supporting insurance liabilities, net | | $ | (0.02 | ) | | $ | (0.52 | ) | Change in experience-rated contractholder liabilities due to asset value changes | | $ | 0.02 | | | $ | 0.43 | | Divested businesses: | | | | | | | | | Closed Block division | | $ | (0.13 | ) | | $ | 0.06 | | Other divested businesses | | $ | (0.08 | ) | | $ | (0.07 | ) | Equity in earnings of operating joint ventures and earnings attributable to noncontrolling interests | | $ | (0.01 | ) | | $ | 0.06 | | Total reconciling items, before income taxes | | $ | 0.31 | | | $ | 1.54 | | Less: Income taxes, not applicable to adjusted operating income | | $ | 0.04 | | | $ | 0.49 | | Total reconciling items, after income taxes | | $ | 0.26 | | | $ | 1.05 | | | After-tax adjusted operating income | | $ | 4.11 | | | $ | 4.65 | |
| | | | | 82 | | | Notice of Annual Meeting of Shareholders and 2017 Proxy Statement |
| | | | | Appendix A
|
| | | | | | | | | | | | | | Year Ended
December 31, | | | | | | | | | | 2018 | | | 2017 | | | | | Net income attributable to Prudential Financial, Inc. | | $ | 4.07 | | | $ | 7.86 | | Income attributable to noncontrolling interests | | | 0.01 | | | | 0.11 | | | | Net income | | | 4.08 | | | | 7.97 | | | | Less: Earnings attributable to noncontrolling interests | | | 0.01 | | | | 0.11 | | | | Income attributable to Prudential Financial, Inc. | | | 4.07 | | | | 7.86 | | | | Less: Equity in earnings of operating joint ventures, net of taxes and earnings attributable to noncontrolling interests | | | 0.06 | | | | (0.06 | ) | | | Income(after-tax) before equity in earnings of operating joint ventures | | | 4.01 | | | | 7.92 | | | | Less: Reconciling Items: | | | | | | | | | Realized investment gains (losses), net, and related charges and adjustments | | | 0.30 | | | | (0.06 | ) | Investment gains (losses) on assets supporting experience-rated contractholder liabilities, net | | | (0.86 | ) | | | 0.34 | | Change in experience-rated contractholder liabilities due to asset value changes | | | 0.71 | | | | (0.15 | ) | Divested andRun-off Businesses: | | | | | | | | | Closed Block Division | | | (0.06 | ) | | | 0.04 | | Other Divested andRun-off Businesses | | | (1.54 | ) | | | 0.04 | | Equity in earnings of operating joint ventures and earnings attributable to noncontrolling interests | | | (0.09 | ) | | | 0.03 | | | | Total reconciling items, before income taxes | | | (1.54 | ) | | | 0.24 | | | | Less: Income taxes, not applicable to adjusted operating income | | | (0.53 | ) | | | (3.03 | ) | | | Total reconciling items, after income taxes | | | (1.01 | ) | | | 3.27 | | | | After-tax adjusted operating income | | $ | 5.02 | | | $ | 4.65 | | | |
ReconciliationsReconciliation of GAAP Earnings per Share toAfter-Tax Adjusted Operating Income Earnings per Share
(shares in millions) | | | | | | Year Ended December 31, | | | | | | | | | | Year Ended December 31 | | | 2018 | | 2017 | | | | | 2016 | | 2015 | | | | | Net income attributable to Prudential Financial, Inc. | | $ | 9.71 | | | $ | 12.17 | | | $ | 9.50 | | | $ | 17.86 | | Less: Income from discontinued operations, net of taxes | | | — | | | | — | | | | Income from continuing operations (after-tax) attributable to Prudential Financial, Inc. | | | 9.71 | | | 12.17 | | | Less: Reconciling Items: | | | | | | | | | Realized investment gains (losses), net, and related charges and adjustments | | | 1.17 | | | 3.43 | | | | 0.71 | | | (0.13 | ) | Investment gains (losses) on trading account assets supporting insurance liabilities, net | | | (0.04 | ) | | (1.14 | ) | | Investment gains (losses) on assets supporting experience-rated contractholder liabilities, net | | | | (2.02 | ) | | 0.77 | | Change in experience-rated contractholder liabilities due to asset value changes | | | 0.05 | | | 0.94 | | | | 1.67 | | | (0.35 | ) | Divested businesses: | | | | | | Closed Block division | | | (0.30 | ) | | 0.13 | | | Other divested businesses | | | (0.19 | ) | | (0.14 | ) | | Divested andRun-off Businesses: | | | | | | Closed Block Division | | | | (0.15 | ) | | 0.10 | | Other Divested andRun-off Businesses | | | | (3.60 | ) | | 0.09 | | Difference in earnings allocated to participating unvested share-based payment awards | | | — | | | (0.02 | ) | | | 0.03 | | | (0.09 | ) | | | | | Total reconciling items, before income taxes | | | 0.69 | | | 3.20 | | | | (3.36 | ) | | 0.39 | | Less: Income taxes, not applicable to adjusted operating income | | | 0.11 | | | 1.07 | | | | (1.17 | ) | | (6.89 | ) | | | | | Total reconciling items, after income taxes | | | 0.58 | | | 2.13 | | | | (2.19 | ) | | 7.28 | | | | | | | After-tax adjusted operating income | | $ | 9.13 | | | $ | 10.04 | | | $ | 11.69 | | | $ | 10.58 | | | | | | Weighted average number of outstanding Common shares (diluted) | | | 446.6 | | | 460.4 | | | | 426.2 | | | 436.0 | | | | | |
| | | | | | | | Notice of Annual Meeting of Shareholders and 20172019 Proxy Statement | | | | 83| | | 99 |
| | |
| | Appendix A | |
Adjusted Book Value ReconciliationsReconciliation of GAAP Book Value to Adjusted Book Value
(in millions, except for per share data) | | | | | | | | | | | | Year Ended December 31 | | | | | 2016 | | | 2015 | | | GAAP book value (total PFI equity) at end of period | | $ | 45,863 | | | $ | 41,890 | | | Less: Accumulated other comprehensive income (AOCI) | | $ | 14,621 | | | $ | 12,285 | | | GAAP book value excluding AOCI | | $ | 31,242 | | | $ | 29,605 | | | Less: Cumulative effect of foreign exchange remeasurement and currency | | | | | | | | | | translation adjustments corresponding to realized gains/losses | | $ | (3,199 | ) | | $ | (3,747 | ) | | Adjusted book value | | $ | 34,441 | | | $ | 33,352 | | | Number of diluted shares at end of period | | | 436.2 | | | | 453.2 | | | GAAP book value per common share - diluted(1) | | | 104.91 | | | | 92.39 | | | Adjusted book value per common share - diluted | | | 78.95 | | | | 73.59 | |
| | | | | | | | | | | | | | As of December 31, | | | | | | | | | | 2018 | | | 2017 | | | | GAAP book value (total Prudential Financial, Inc. equity) at end of period(1) | | $ | 48,617 | | | $ | 54,236 | | Less: Accumulated other comprehensive income (AOCI) | | $ | 10,906 | | | $ | 17,074 | | | | GAAP book value excluding AOCI(1) | | $ | 37,711 | | | $ | 37,162 | | Less: Cumulative effect of foreign currency exchange rate remeasurement and changes in certain deferred taxes | | ($ | 2,344 | ) | | ($ | 969 | ) | | | Adjusted book value(1) | | $ | 40,055 | | | $ | 38,131 | | | | Number of diluted shares at end of period(2) | | | 422.2 | | | | 435.7 | | | | GAAP book value per Common share - diluted(1)(2) | | $ | 116.34 | | | $ | 125.63 | | Adjusted book value per Common share - diluted(1)(2)(3) | | $ | 96.06 | | | $ | 88.67 | | | |
| (1) | Book value per share2017 amounts have been revised resulting from the elimination of Common Stock, including accumulated other comprehensive income, for the fourth quarterGibraltar Life’sone-month reporting lag. |
| (2) | As of 2015, includes a $500 million increase in equity and a 5.6 million increase in diluted shares reflecting the dilutive impact ofDecember 31, 2017, exchangeable surplus notes are dilutive when book value per share is greater than $88.90. The fourth quarter of 2016 includes a $500$85.00 (equivalent to an additional 5.88 million increase in equity and a 5.75 million increase in diluted shares reflecting the dilutive impactand an increase of $500 million in equity). As of December 31, 2018, exchangeable surplus notes are dilutive when book value per share is greater than $86.92.$82.16 (equivalent to an additional 6.09 million in diluted shares and an increase of $500 million in equity). |
| (3) | Includes the cumulative impact of net gains and losses resulting from foreign currency exchange rate remeasurement and associated realized investment gains and losses included in net income (loss) and currency translation adjustments corresponding to realized investment gains and losses. Includes $1,678 million impact reported in net income for 2017 from the remeasurement of deferred tax assets and liabilities originally established through accumulated other comprehensive income, related to enactment of the Tax Cuts and Jobs Act on December 22, 2017. |
Operating Return on Average Equity Operating Returnreturn on Average Equityaverage equity (based on adjusted operating income) is anon-GAAP measure and represents adjusted operating incomeafter-tax divided by average Prudential Financial, Inc. equity excluding accumulated other comprehensive income and adjusted book value.to remove amounts included for foreign currency exchange rate remeasurement and certain deferred taxes. The comparable GAAP measure to operating return on average equity (based on adjusted operating income) is return on average equity (based on income from continuing operations)net income). Return on average equity (based on income from continuing operations)net income) represents income from continuing operations after-tax, attributable to consolidated Prudential Financial, Inc., as determined in accordance with U.S. GAAP, divided by average total Prudential Financial, Inc. equity. Return on average equity (based on income from continuing operations)net income) was 8.8%8.2% and 16.0% for the yearyears ended December 31, 2016.2018 and December 31, 2017, respectively. | | | | | 84 | | | 100 | | | | | Notice of Annual Meeting of Shareholders and 20172019 Proxy Statement |
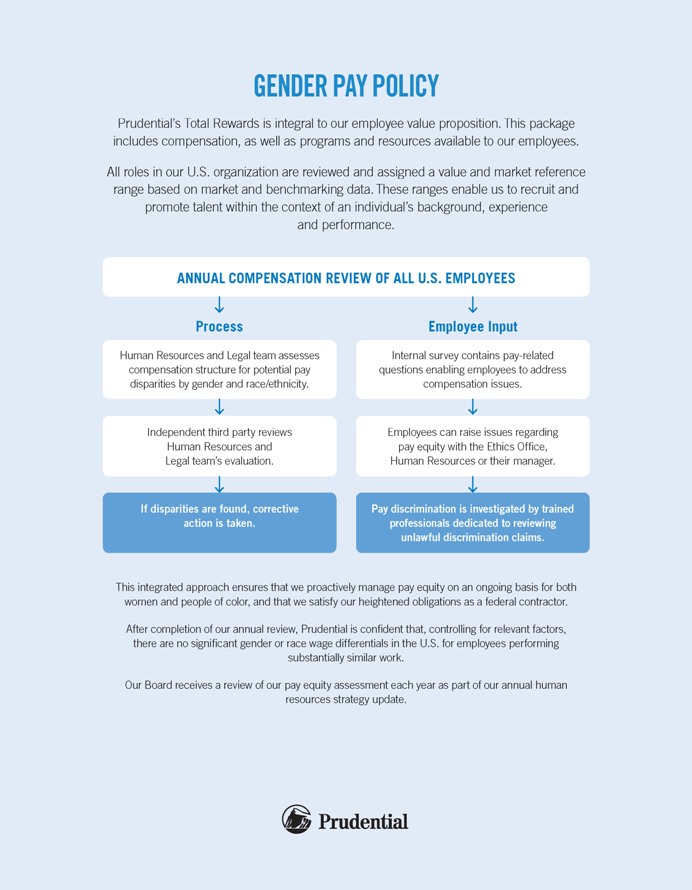
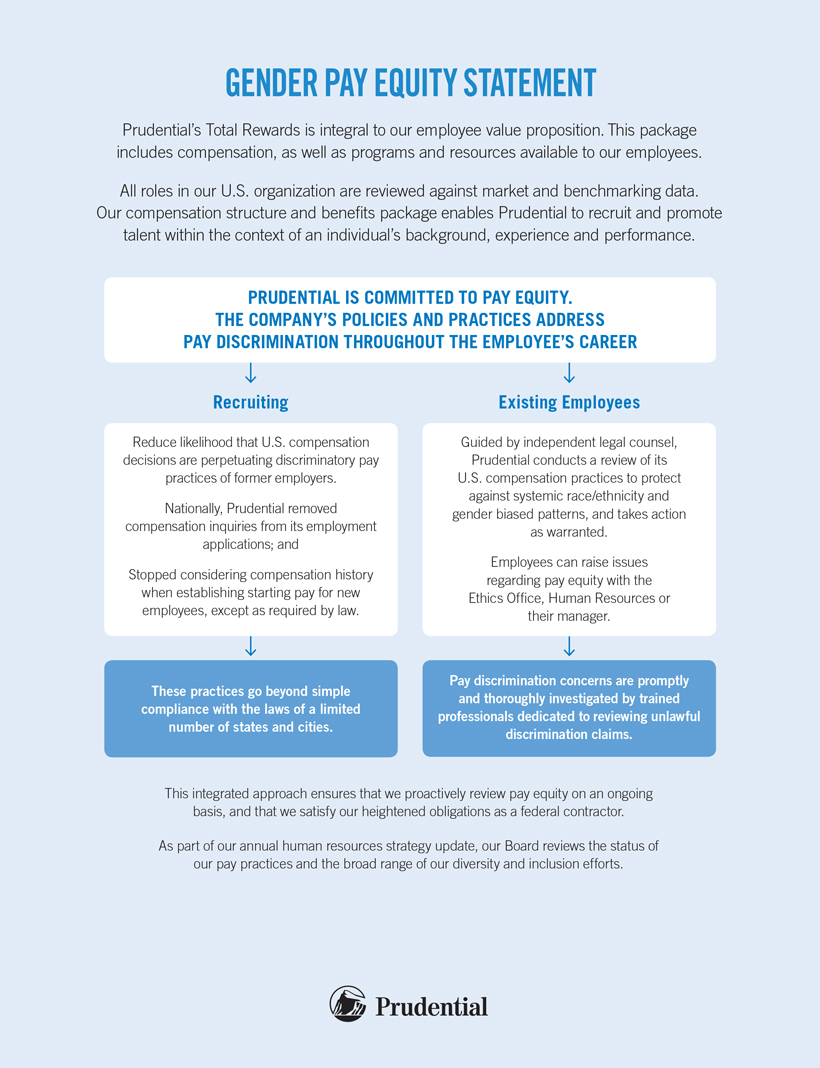
GENDER PAY POLICY Prudential’sEQUITY STATEMENT Prudentials Total Rewards is integral to our employee value proposition. This package includes compensation, as well as programs and resources available to our employees.
All roles in our U.S. organization are reviewed and assigned a value and market reference range based onagainst market and benchmarking data. These ranges enable usOur compensation structure and benefits package enables Prudential to recruit and promote talent within the context of an individual’sindividuals background, experience and performance. ANNUAL COMPENSATION REVIEW OF ALL PRUDENTIAL IS COMMITTED TO PAY EQUITY. THE COMPANYS POLICIES AND PRACTICES ADDRESS PAY DISCRIMINATION THROUGHOUT THE EMPLOYEES CAREER Recruiting Existing Employees Reduce likelihood that U.S. EMPLOYEES
Process
Human Resourcescompensation decisions are perpetuating discriminatory pay practices of former employers. Nationally, Prudential removed compensation inquiries from its employment applications; and Legal team assessesStopped considering compensation structurehistory when establishing starting pay for potential pay disparitiesnew employees, except as required by law. Guided by independent legal counsel, Prudential conducts a review of its U.S. compensation practices to protect against systemic race/ethnicity and gender biased patterns, and race/ethnicity.
Independent third party reviews Human Resources and Legal team’s evaluation.
If disparities are found, correctivetakes action is taken.
Employee Input
Internal survey contains pay-related questions enabling employees to address compensation issues.
as warranted. Employees can raise issues regarding pay equity with the Ethics Office, Human Resources or their manager. These practices go beyond simple compliance with the laws of a limited number of states and cities. Pay discrimination isconcerns are promptly and thoroughly investigated by trained professionals dedicated to reviewing unlawful discrimination claims. This integrated approach ensures that we proactively managereview pay equity on an ongoing basis, for both women and people of color, and that we satisfy our heightened obligations as a federal contractor. After completion of our annual review, Prudential is confident that, controlling for relevant factors, there are no significant gender or race wage differentials in the U.S. for employees performing substantially similar work.
Our Board receives a review of our pay equity assessment each year as As part of our annual human resources strategy update.
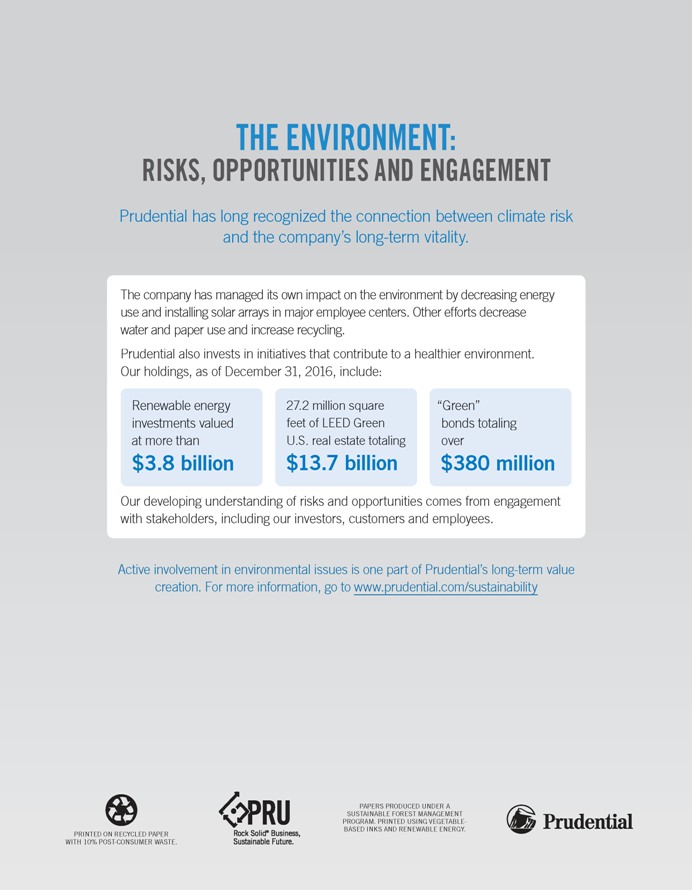
THE ENVIRONMENT:
RISKS, OPPORTUNITIES AND ENGAGEMENT
Prudential has long recognizedupdate, our Board reviews the connection between climate riskstatus of our pay practices and the company’s long-term vitality.broad range of our diversity and inclusion efforts.
PRUDENTIAL IS HELPING INCREASE FINANCIAL WELLNESS FOR ALL Americans are facing daunting financial challenges requiring innovative solutions and collaboration among public, private and nonprofit sectors that reconnect the rewards of work with the ability to build wealth. Prudential cites these statistics in its white paper "Increasing Financial Security with Workplace Emergency Savings": 63 percent of Americans can't afford a $500 emergency and 31 percent of employees would consider retirement plan loans or withdrawals to cover those [unexpected] expenses. Prudential, a leader in the national dialogue to improve policies and practices enabling financial stability, mobility and prosperity for all, is doubling down on financial wellness. People achieve financial wellness when they adopt behaviors that help them manage day-to-day finances, realize financial goals, and protect against financial risks. 63% of Americans don't have enough savings to meet a $500 emergency* Prudential collaborated with Prosperity Now, a nonprofit organization that works to ensure everyone has a clear path to financial stability, wealth and prosperity, to design a solution to increase emergency savings by using payroll deductions to fund after-tax retirement contributions. Prudential Retirement(R) is now offering an in-plan, after-tax emergency savings feature to plan sponsors as part of their holistic workplace financial wellness package, which is inclusive and accessible to both low and high-income earners addressing the needs of American workers across all income brackets. The company has managed its own impact onplan's unique feature enables participants to access funds with lower withdrawal fees and tax consequences versus pre-tax transactions helping them address emergencies. Eligible employees at Prudential have the environment by decreasing energy useopportunity to accumulate after-tax savings in the Prudential Employees Savings Plan (PESP). At a crucial time for many, Prudential is working hard to create realistic and installing solar arraysaccessible financial solutions to make people's lives better in major employee centers. Other efforts decrease wateran ever-changing world. We do this because we believe that companies can and paper use and increase recycling. Prudential also invests in initiatives that contribute to a healthier environment. Our holdings, as of December 31, 2016, include:
Renewable energy investments valued atshould do more than $3.8 billion
27.2 million square feetgenerate profits we should help drive progress.* McGrath, Maggie; Forbes.com, "63% of LEED Green U.S. real estate totaling $13.7 billion
“Green” bonds totaling over $380 million
Our developing understanding of risks and opportunities comes from engagement with stakeholders, including our investors, customers and employees.
Active involvement in environmental issues is one part of Prudential’s long-term value creation. For more information, goAmericans Don't Have Enough Savings to www.prudential.com/sustainability
Cover a $500 Emergency," 2016 PRINTED ON RECYCLED PAPER WITH 10% POST-CONSUMER WASTE. Rock Solid(R) Business, Sustainable Future. PAPERS PRODUCED UNDER A SUSTAINABLE FOREST MANAGEMENT PROGRAM. PRINTED USING VEGETABLE-BASED INKS AND RENEWABLE ENERGY.

| | | IMPORTANT ANNUAL MEETING INFORMATION | | |
| | | Admission Ticket | | | | | | | | | | | | | | | | Electronic Voting Instructions | | You can vote by Internet or telephone | | Instead of mailing your proxy, you may choose to vote online or by telephone. | | Proxies submitted by the Internet or telephone must be received by 11:59 p.m., May 08, 2017, for Registered Shares and by 11:59 p.m., May 03, 2017, for PESP Shares and PSPP Shares.
| 
| | Vote by Internet
| | • Go towww.investorvote.com/prudential.
| | • Follow the steps outlined on the secured website.
| 
| | Vote by telephone
| | • Call toll free1-800-652-VOTE (8683)within the USA, US territories & Canada any time on a touch tone telephone. There isNO CHARGEto you for the call.
| | • Follow the instructions provided by the recorded message.
|
| | | Proxy/Voting Instruction Form | | 
|
q IF YOU HAVE NOT VOTED VIA THE INTERNETOR TELEPHONE, FOLD ALONG THE PERFORATION, DETACH AND RETURN THE BOTTOM PORTION IN THE ENCLOSED ENVELOPE.q
| | | | | A | | Proposals — The Board of Directors recommends a voteFOR the election of each director nominee listed in Proposal 1. | | |
| | | | | | | | | | | | | | | | | | | | | | | | | | | 1. Election of Directors:
| | For | | Against | | Abstain | | | | For | | Against | | Abstain | | | | For | | Against | | Abstain | | + | | | 01 - Thomas J. Baltimore, Jr. | | ☐ | | ☐ | | ☐ | | 05 - Karl J. Krapek | | ☐ | | ☐ | | ☐ | | 09 - Christine A. Poon | | ☐ | | ☐ | | ☐ | | | | | | | | | | | | | | | | | 02 - Gilbert F. Casellas | | ☐ | | ☐ | | ☐ | | 06 - Peter R. Lighte | | ☐ | | ☐ | | ☐ | | 10 - Douglas A. Scovanner | | ☐ | | ☐ | | ☐ | | | | | | | | | | | | | | | | | | | 03 - Mark B. Grier | | ☐ | | ☐ | | ☐ | | 07 - George Paz | | ☐ | | ☐ | | ☐ | | 11 - John R. Strangfeld | | ☐ | | ☐ | | ☐ | | | | | | | | | | | | | | | | | | | 04 - Martina Hund-Mejean | | ☐ | | ☐ | | ☐ | | 08 - Sandra Pianalto | | ☐ | | ☐ | | ☐ | | 12 - Michael A. Todman | | ☐ | | ☐ | | ☐ | | | | |
| | | | | | | | | | | | | | | | | | | | | The Board of Directors recommends a voteFOR Proposal 2, 3 and1 YEAR For Proposal 4. | | | | | | | | | | | | | | | | | | | | | | | | For | | Against | | Abstain | | | | | | | | | | | | | 2. Ratification of the appointment of PricewaterhouseCoopers LLP as our independent registered public accounting firm for 2017.
| | | | ☐ | | ☐ | | ☐ | | | | The Board of Directors recommends a voteAGAINST Proposal 5. | | | | | | | | | | | | | | | | For | | Against | | Abstain | | | 3. Advisory vote to approve named executive officer compensation.
| | | | ☐ | | ☐ | | ☐ | | | | 5. Shareholder proposal regarding an independent Board Chairman.
| | ☐ | | ☐ | | ☐ | | | | | 1 Year | | 2 Years | | 3 Years | | Abstain | | | | | | | | | | | | | | | | | | | | | | | | 4. Advisory Vote on frequency.
| | ☐ | | ☐ | | ☐ | | ☐ | | | | | | | | | | | | |
| | | | | B | | Non-Voting Proposal – Please select one option or leave blank if you do not want to participate. | | |
| | I would like a free tote bag from Prudential. ☐ I prefer Prudential contribute to a tree planting campaign. ☐ |
| | | | | C | | Authorized Signatures — This section must be completed for your vote to be counted. — Date and Sign Below | | |
| | | | | | | | | | | | | | | | | | | Please sign exactly as name(s) appears hereon. Joint owners should each sign. When signing as attorney, executor, administrator, corporate officer, trustee, guardian, or custodian, please give full title. | | |
| | | | | | | Date (mm/dd/yyyy) — Please print date below.
| | Signature 1 — Please keep signature within the box.
| | Signature 2 — Please keep signature within the box.
| | |
| | | | | | | | | | 
| | ANNUAL MEETING OF SHAREHOLDERS | |  | | May 09, 2017, 2:30 p.m. | | | 751 Broad Street, Newark, New Jersey 07102 | | | | | | | | | |
If you plan to attend the annual meeting, please bring this admission ticket with you.This ticket admits the shareholder. All meeting attendees must present valid government-issued photo identification. For your safety, all personal belongings or effects including bags, purses, and briefcases are subject to inspection. With the exception of purses and notepads, no personal items such as briefcases or bags, of any type, may be carried into the meeting area. The use of photographic and recording devices is prohibited in the building. Cell phone use is permitted only in the first floor lobby. The meeting location is accessible to disabled persons and, upon request, we will provide wireless headsets for hearing amplification.
This card covers the total number of shares of Prudential Financial, Inc. Common Stock (“Common Stock”) registered in your name (“Registered Shares”) at Prudential’s transfer agent, Computershare, as of March 10, 2017, and may also cover the total number of shares of Prudential Financial, Inc. Common Stock held in The Prudential Employee Savings Plan (“PESP”) on March 7, 2017. Or, this card may cover the total number of shares of Prudential Financial, Inc. Common Stock for the international portion of the Prudential Stock Purchase Plan, the Prudential International Stock Purchase Plan, or the international portion of the Associates Grants (including vested shares of Prudential Financial, Inc. Common Stock) registered in your name with Computershare as of the close of business on the record date of March 10, 2017.
You only need to vote once. This card enables you to submit your vote on your Registered Shares; to provide voting instructions to the PESP Trustee for your PESP shares; or to submit voting instructions for your International portion of the Prudential Stock Purchase Plan shares.
Important Notice Regarding the Availability of Proxy Materials for the Shareholder Meeting to be held on May 9, 2017. The Proxy Statement and Annual Report to Shareholders are available atwww.investorvote.com/prudential
q IF YOU HAVE NOT VOTED VIA THE INTERNETOR TELEPHONE, FOLD ALONG THE PERFORATION, DETACH AND RETURN THE BOTTOM PORTION IN THE ENCLOSED ENVELOPE.q
| | | | | Proxy/Voting Instruction Form
| | Prudential Financial, Inc. | | +
|
This proxy is solicited on behalf of the Board of Directors of Prudential Financial, Inc. for the Annual Meeting of Shareholders to be held at 2:30 p.m. on May 9, 2017.
The undersigned, having received the Notice of Meeting and Proxy Statement dated March 21, 2017, appoints Margaret M. Foran, Timothy P. Harris and John R. Strangfeld, each of them as proxies, with full power of substitution, to represent and vote all of the undersigned’s shares of Common Stock of Prudential Financial, Inc., at the Annual Meeting of Shareholders to be held at 2:30 p.m., May 9, 2017, or at any adjournment or postponement, upon all subjects that may properly come before the meeting, including the matters described in the proxy statement, subject to any directions indicated on the reverse side of this card.
If no directions are given, the proxies will vote in accordance with Board of Directors’ recommendations as listed on the reverse side of this card and at their discretion on any other matter that may properly come before the meeting.
Special Voting Instructions for Plan Shares: If you are a participant in The Prudential Employee Savings Plan (“PESP”), or the international portion of the Prudential Stock Purchase Plan, the Prudential International Stock Purchase Plan, or the international portion of the Associates Grants (including vested shares of Prudential Financial, Inc. Common Stock) under the Prudential Financial, Inc. Omnibus Incentive Plan, your shares will be voted by the applicable trustee or administrator in accordance with the instructions indicated on the reverse side or received by internet or telephone. If no instructions are specified, your PESP shares will be voted in the same proportion as the PESP Trustee votes the shares for which it received timely voting instructions, and all other shares will be voted by the plan administrator in accordance with the Board of Directors’ recommendations, in each case, subject to the terms of the applicable plan documents and applicable law.
Comments — We value your feedback. Please provide any comments you have in the space below.
| | |  | | + |
IMPORTANT SHAREHOLDER INFORMATION
YOUR VOTE COUNTS!
| | | | | | | | | ANNUAL MEETING OF SHAREHOLDERS
 | |  | | | | | | May 09, 2017, 2:30 p.m. | | | | | 751 Broad Street, Newark, New Jersey 07102 | | | | | | | | You can vote and obtain proxy materials online. | | | | | | | | VOTING INSTRUCTIONS ARE LOCATED BELOW
Dear Shareholder: |
| | | | | Shareholder Meeting Notice & Admission Ticket | | | | | This package includes your proxy and voting materials. We care about what you think and voting is an important way for you to let us know how we’re doing. | | | | | |  |
Important Notice Regarding the Availability of Proxy Materials for the
Prudential Financial, Inc. Shareholder Meeting to be Held on May 09, 2017
The proxy materials for the annual meeting are available online. The items to be voted on are listed below. Follow the instructions to view the materials and vote online. Your vote is important! To obtain a paper or e-mail copy of the proxy materials follow the instructions on the reverse side.
Proposals to be voted on at the meeting are listed below along with the Board of Directors’ recommendations.
The Board of Directors recommends that you voteFOR Proposals 1 – 3 and 1 year for Proposal 4.
To express our appreciation when you vote, we are once again offering you a choice of receiving a specially designed, environmentally friendly tote bag, or contributing to a tree-planting campaign. Since its inception, we have provided nearly 630,000 tote bags to our shareholders. Because of your active participation, we continue to support the work of American Forests to protect and restore America’s forest ecosystems. This year’s tree-planting initiative will continue our work with American Forests. | | 1. | Election of Directors: Thomas J. Baltimore, Jr., Gilbert F. Casellas, Mark B. Grier, Martina Hund-Mejean, Karl J. Krapek, Peter R. Lighte, George Paz, Sandra Pianalto, Christine A. Poon, Douglas A. Scovanner, John R. Strangfeld and Michael A. Todman. |
| 2. | Ratification of the appointment of PricewaterhouseCoopers LLP as our independent registered public accounting firm for 2017. |
| 3. | Advisory vote to approve named executive officer compensation. |
| 4. | Advisory vote on frequency. |
The Board of Directors recommends that you voteAGAINST Proposal 5:
| 5. | Shareholder proposal regarding an independent Board Chairman. |
This communication presents only an overview of the more complete proxy materials that are available to you on the Internet.
We encourage you to access and review all of the important information contained in the proxy materials before voting.
The proxy statement and annual report to shareholders are available at www.investorvote.com/prudential.
| | | 
| | Easy Online Access — A Convenient Way to Vote! | | | Whether you vote via the internet, phone, or mail, you can indicate your choice of either the bag or a tree-planting contribution. If you have accesselect to the Internet,receive a bag, you can completeexpect to receive your free gift around the process in a few easy steps:end of June. | | | | | | | Step 1: Go towww.investorvote.com/prudentialThank you,
| | | | | | | Step 2: Click theView buttons to see the proxy statement, which contains details of the proposals to be voted on, and the annual report.
| | | | | | | Step 3: Follow the instructions on the screen to log in.Margaret M. Foran
| | | Step 4: Make your selection as instructed on each screen to select delivery preferences.
| | | | Chief Governance Officer, | | | Step 5: Make your voting selections as instructed on the screen and click the vote button to submit your vote. |
PLEASE NOTE — YOU CANNOT VOTE BY RETURNING THIS NOTICE. To vote your shares, you must vote online or request a paper copy of the proxy materials to receive a proxy card.
| | | | | ∎ | | 2 N O T
| | +Senior Vice President and Corporate Secretary | | | | | | Prudential Financial, Inc. |
02IB8C002CSN9BE2
Shareholder Meeting Notice & Admission Ticket
| | | 
 | | Obtaining a Copy of the Proxy Materials – If you want to receive a paper or e-mail copy of these documents, you must request one. There is no charge to you for requesting a copy. Please make your request for a copy as instructed below on or before April 28, 2017, to facilitate timely delivery. | | You may still request paper copies of the materials after this date; however, your vote will not count if received after 11:59 p.m. on May 08, 2017, via the Internet or telephone or after 10:00 a.m. on May 09, 2017, via a proxy card.
|
Here’s how to order a copy of the proxy materials and select future delivery preference:
Paper copies: Current and future paper delivery requests can be submitted via the telephone, Internet or e-mail options below.
E-mail copies: Current and future e-mail delivery requests must be submitted via the Internet or e-mail following the instructions below. If you request an e-mail copy of the materials, you will receive an e-mail with a link to view the materials on the Internet.
PLEASE NOTE: You must use the number in the shaded bar on the reverse side when requesting a set of proxy materials.
| g | Internet– Go to www.investorvote.com/prudential. Follow the instructions to log in and order a paper or e-mail copy of the current meeting materials and submit your preference for e-mail or paper delivery of future meeting materials. |
| g | Telephone– Call us free of charge at 1-866-641-4276 using a touch-tone phone and follow the instructions to log in and order a paper copy of the materials by mail for the current meeting. You can also submit a preference to receive a paper copy for future meetings. |
| g | E-mail– Send an e-mail to investorvote@computershare.com with “Proxy Materials Prudential” in the subject line. In the e-mail, include your full name and address, plus the number located in the shaded bar on the reverse side of this document. State in the e-mail whether you want a paper or e-mail copy of the current meeting materials. You can also state your preference for an e-mail or paper copy for future meetings. |
If you wish to attend and vote at the meeting, please bring this notice and identification with you.
Prudential Financial, Inc.’s Annual Meeting of Shareholders will be held on May 09, 2017, at 751 Broad Street, Newark, New Jersey 07102, at 2:30 p.m.
If you plan to attend the annual meeting, please bring this admission ticket with you. This ticket admits the shareholder. All meeting attendees must present valid government-issued photo identification. For your safety, all personal belongings or effects including bags, purses, and briefcases are subject to inspection. With the exception of purses and notepads, no personal items such as briefcases or bags, of any type, may be carried into the meeting area. The use of photographic and recording devices is prohibited in the building. Cell phone use is permitted only in the first floor lobby. The meeting location is accessible to disabled persons and, upon request, we will provide wireless headsets for hearing amplification.

02IB8C
| | |  | | Margaret M. Foran | | | Chief Governance Officer | | | Senior Vice President and Corporate Secretary | | | Prudential Financial, Inc. | | | 751 Broad Street, Newark NJ 07102-3777 | | | | | March 21, 201728, 2019 |
Dear Shareholder: As a shareholder, you have the right to vote on important matters that affect Prudential Financial. We take the opinions of Prudential’s shareholders very seriously and we hope you will provide your input by casting your vote on the items in the 20172019 Proxy Statement. Enclosed you will find a Notice of Internet Availability (Notice), which provides information on how to view the materials and cast your vote online. If you would prefer to vote by mail, you may request a paper copy of the proxy materials by visiting www.investorvote.com/prudential, calling1-866-641-4276, or by sending an email to investorvote@computershare.com. Additional information regarding the Notice is located on the reverse side of this letter. The SEC has also created an educational website where you can learn more about proxy voting —www.sec.gov/spotlight/proxymatters.shtml.proxymatters.shtml. To express our appreciation when you vote, we are once again offering you a choice of receiving a specially designed, environmentally friendly tote bag, or contributing to a tree-planting campaign.initiative. Since this program’sits inception, we have planted more than 730,000 trees through our partnership with American Forests and have provided nearly 525,000630,000 tote bags to our shareholders. Because of your active participation, we continue to support the work of American Forests to protect and restore America’s forest ecosystems. This year’s tree-planting initiative will continue to support our work with American Forests in our National Parks.Forests. As always, we thank you for your investment in Prudential. Sincerely, |   | | Margaret M. Foran | | Chief Governance Officer, | | Senior Vice President and Corporate Secretary | | Prudential Financial, Inc. |
© 20172019 Prudential Financial, Inc., and its related entities. All rights reserved.
FAQ –— Internet Availability of Proxy Materials The Securities and Exchange Commission (SEC) has issued rules requiring public companies to: Make proxy materials (such as the Annual Report and Proxy Statement) available on the Internetinternet Notify shareholders how and where to access those materials online These rules allow companies to give shareholders more options for reviewing important proxy materials. Information can be made available to shareholders more quickly and conveniently—online documents are easily searchable, enabling shareholders to quickly find the information they need to make informed voting decisions. The SEC also allows companies to send aone-page Notice to holders with instructions on how to access the materials online, rather than sending a full set of materials. Our reasons for choosing the notice-only option are to: Adopt more sustainable practices and be more environmentally responsible—by shrinking our carbon footprint through reductions in ink and paper used in printing and fuel used in shipping Increase shareholder value—by reducing print and mail costs Please refer to the information below to learn more and to find out what your options are as a shareholder to view materials and vote. What is on theone-page Notice? The Notice contains simple instructions on how to: Access and view the proxy materials online Request a free set of printed materials Change delivery preferences for future proxy mailings DOretain the Notice for future reference DO NOTmark your vote on the Notice and return it; the Notice is not a proxy card or ballot If I received only aone-page Notice, how do I vote my shares? To vote your shares, follow the instructions on the Notice to vote online. If you request a paper copy of the proxy materials, you’ll receive a proxy card with voting instructions. You may also vote your shares in person by bringing the Notice with you and attending the meeting. If I received only aone-page Notice, how do I request a full set of printed materials for this meeting or future proxy mailings? To request a free set of printed materials for this meeting or for future mailings, refer to the Notice for detailed instructions on how to request a copy via Internet,internet, telephone or email. If I received a full set of materials, may I request only aone-page Notice for future proxy mailings? Our company will make a decision for each meeting whether or not to use the notice-only option, and send notice-only mailings at our discretion. Can I elect to receive my proxy materials electronically? You may elect to receive materials via email for future mailings. You will receive the materials electronically if our company chooses to offer email delivery in the future. To change your delivery preferences, follow the instructions on the Notice. | One of your key privileges as an investor is the right to vote on important matters that affect the company you own shares in. Please vote. Your vote is important to us and our business. |
| | | 002CSN7BB7002CSN9BE3 | | © Copyright 2017 Computershare Limited. All rights reserved. |

| | | | IMPORTANT ANNUAL MEETING INFORMATION | | |
| | | | Admission Ticket | | | | | | | | | | | | | | | | | Electronic Voting Instructions | | | You can vote by Internet or telephone | | Instead of mailing your proxy, you may choose to vote online or by telephone. | | Proxies submitted by the Internet or telephone must be received by 11:59 p.m., May 13, 2019, for Registered Shares and by 11:59 p.m., May 8, 2019, for PESP Shares and PSPP Shares. | 
| | Vote by Internet | | • Go towww.investorvote.com/prudential | | • Follow the steps outlined on the secured website. | 
| | Vote by telephone | | • Call toll free1-800-652-VOTE (8683) within the USA, US territories & Canada any time on a touch tone telephone. There isNO CHARGEto you for the call. | | • Follow the instructions provided by the recorded message. |
| | | | Proxy/Voting Instruction Form | | 
|
q IF YOU HAVE NOT VOTED VIA THE INTERNETORTELEPHONE, FOLD ALONG THE PERFORATION, DETACH AND RETURN THE BOTTOM PORTION IN THE ENCLOSED ENVELOPE.q | | | | | | A | | Proposals — The Board of Directors recommends a voteFOR the election of each director nominee listed in Proposal 1. | | |
| | | | | | | | | | | | | | | | | | | | | | | | | | | 1. Election of Directors: | | For | | Against | | Abstain | | | | For | | Against | | Abstain | | | | For | | Against | | Abstain | | + | | | | 01 - Thomas J. Baltimore, Jr. | | ☐ | | ☐ | | ☐ | | 06 - Karl J. Krapek | | ☐ | | ☐ | | ☐ | | 11 - Christine A. Poon | | ☐ | | ☐ | | ☐ | | | | | | | | | | | | | | | | 02 - Gilbert F. Casellas | | ☐ | | ☐ | | ☐ | | 07 - Peter R. Lighte | | ☐ | | ☐ | | ☐ | | 12 - Douglas A. Scovanner | | ☐ | | ☐ | | ☐ | | | | | | | | | | | | | | | | | | | | 03 - Robert M. Falzon | | ☐ | | ☐ | | ☐ | | 08 - Charles F. Lowrey | | ☐ | | ☐ | | ☐ | | 13 - Michael A. Todman | | ☐ | | ☐ | | ☐ | | | | | | | | | | | | | | | | | | | | 04 - Mark B. Grier | | ☐ | | ☐ | | ☐ | | 09 - George Paz | | ☐ | | ☐ | | ☐ | | | | | | | | | | | | | | | | | | | | | | | | | | | | 05 - Martina Hund-Mejean | | ☐ | | ☐ | | ☐ | | 10 - Sandra Pianalto | | ☐ | | ☐ | | ☐ | | | | | | | | | | | | |
| | | | | | | | | | | | | | | | | | | | | | The Board of Directors recommends a voteFOR Proposals 2 and 3. | | The Board of Directors recommends a voteAGAINST Proposal 4. | | | | | | | | | | | | | | | | | | For | | Against | | Abstain | | | | | | For | | Against | | Abstain | | | 2. Ratification of the appointment of PricewaterhouseCoopers LLP as our independent registered public accounting firm for 2019. | | | | ☐ | | ☐ | | ☐ | | | | 4. Shareholder proposal regarding Right to Act by Written Consent. | | ☐ | | ☐ | | ☐ | | | 3. Advisory vote to approve named executive officer compensation. | | | | ☐ | | ☐ | | ☐ | | | | | | | | | | | | |
| | | | | | B | | Non-Voting Proposal — Please select one option or leave blank if you do not want to participate. | | |
| | | I would like a free tote bag from Prudential. ☐ I prefer Prudential contribute to a tree planting campaign. ☐ |
| | | | | | C | | Authorized Signatures — This section must be completed for your vote to be counted. — Date and Sign Below | | |
| | | | | | | | | | | | | | | | | | | | Please sign exactly as name(s) appears hereon. Joint owners should each sign. When signing as attorney, executor, administrator, corporate officer, trustee, guardian, or custodian, please give full title. | | |
| | | | | | | Date (mm/dd/yyyy) — Please print date below. | | Signature 1 — Please keep signature within the box. | | Signature 2 — Please keep signature within the box. | | |

| | | | IMPORTANT ANNUAL MEETING INFORMATION | | |
| | | | | Proxy/Voting Instruction Form | | | | |
q PLEASE FOLD ALONG THE PERFORATION, DETACH AND RETURN THE BOTTOM PORTION IN THE ENCLOSED ENVELOPE.q | | | | | | A | | Proposals — The Board of Directors recommends a voteFOR the election of each director nominee listed in Proposal 1. | | |
| | | | | | | | | | | | | | | | | | | | | | | | | | | 1. Election of Directors: | | For | | Against | | Abstain | | | | For | | Against | | Abstain | | | | For | | Against | | Abstain | | + | | | | 01 - Thomas J. Baltimore, Jr. | | ☐ | | ☐ | | ☐ | | 06 - Karl J. Krapek | | ☐ | | ☐ | | ☐ | | 11 - Christine A. Poon | | ☐ | | ☐ | | ☐ | | | | | | | | | | | | | | | | 02 - Gilbert F. Casellas | | ☐ | | ☐ | | ☐ | | 07 - Peter R. Lighte | | ☐ | | ☐ | | ☐ | | 12 - Douglas A. Scovanner | | ☐ | | ☐ | | ☐ | | | | | | | | | | | | | | | | | | | | 03 - Robert M. Falzon | | ☐ | | ☐ | | ☐ | | 08 - Charles F. Lowrey | | ☐ | | ☐ | | ☐ | | 13 - Michael A. Todman | | ☐ | | ☐ | | ☐ | | | | | | | | | | | | | | | | | | | 04 - Mark B. Grier | | ☐ | | ☐ | | ☐ | | 09 - George Paz | | ☐ | | ☐ | | ☐ | | | | | | | | | | | | | | | | | | | | | | | | | | | | 05 - Martina Hund-Mejean | | ☐ | | ☐ | | ☐ | | 10 - Sandra Pianalto | | ☐ | | ☐ | | ☐ | | | | | | | | | | | | |
| | | | | | | | | | | | | | | | | | | | | | The Board of Directors recommends a voteFOR Proposals 2 and 3. | | The Board of Directors recommends a voteAGAINST Proposal 4. | | | | | | | | | | | | | | | | For | | Against | | Abstain | | | | | | For | | Against | | Abstain | | | 2. Ratification of the appointment of PricewaterhouseCoopers LLP as our independent registered public accounting firm for 2019. | | | | ☐ | | ☐ | | ☐ | | | | 4. Shareholder proposal regarding Right to Act by Written Consent. | | ☐ | | ☐ | | ☐ | | | | | | | | | | | | | | | | | | | | | | | 3. Advisory vote to approve named executive officer compensation. | | | | ☐ | | ☐ | | ☐ | | | | | | | | | | | | |
| | | | | | B | | Non-Voting Proposal — Please select one option or leave blank if you do not want to participate. | | |
| | | I would like a free tote bag from Prudential. ☐ I prefer Prudential contribute to a tree planting campaign. ☐ |
| | | | | | C | | Authorized Signatures — This section must be completed for your vote to be counted. — Date and Sign Below | | |
| | | | | | | | | | | | | | | | | | | | Please sign exactly as name(s) appears hereon. Joint owners should each sign. When signing as attorney, executor, administrator, corporate officer, trustee, guardian, or custodian, please give full title. | | |
| | | | | | | Date (mm/dd/yyyy) — Please print date below. | | Signature 1 — Please keep signature within the box. | | Signature 2 — Please keep signature within the box. | | |
| | | | | | | | | | | | ANNUAL MEETING OF SHAREHOLDERS | | | | May 14, 2019, 2:00 p.m. | | 751 Broad Street, Newark, New Jersey 07102 | | | | | | | |
. If you plan to attend the annual meeting, please bring proof of ownership with you.Your proof of ownership, such as a recent brokerage statement or letter from your bank or broker, admits the shareholder. All meeting attendees must present valid government-issued photo identification. If you want to vote your shares held in street name in person, you must get a legal proxy in your name from the broker, bank or other nominee that holds your shares. For your safety, all personal belongings or effects including purses are subject to inspection. With the exception of purses and notepads, no personal items such as briefcases or bags, of any type, may be carried into the meeting area. The use of photographic and recording devices is prohibited in the building. Cell phone use is permitted only in the first floor lobby. The meeting location is accessible to disabled persons and, upon request, we will provide wireless headsets for hearing amplification. q IF YOU HAVE NOT VOTED VIA THE INTERNETOR TELEPHONE, FOLD ALONG THE PERFORATION, DETACH AND RETURN THE BOTTOM PORTION IN THE ENCLOSED ENVELOPE.q | | | | | Proxy – Prudential Financial, Inc. | | | | |
This proxy is solicited on behalf of the Board of Directors of Prudential Financial, Inc. for the Annual Meeting of Shareholders to be held at 2:00 p.m. on May 14, 2019. The undersigned, having received the Notice of Meeting and Proxy Statement dated March 28, 2019, appoints Margaret M. Foran, Timothy P. Harris and Charles F. Lowrey, each of them as proxies, with full power of substitution, to represent and vote all of the undersigned’s shares of Common Stock of Prudential Financial, Inc., at the Annual Meeting of Shareholders to be held at 2:00 p.m., May 14, 2019, or at any adjournment or postponement, upon all subjects that may properly come before the meeting, including the matters described in the proxy statement, subject to any directions indicated on the reverse side of this card. If no directions are given, the proxies will vote in accordance with Board of Directors’ recommendations as listed on the reverse side of this card and at their discretion on any other matter that may properly come before the meeting. Important Notice Regarding the Availability of Proxy Materials for the Shareholder Meeting to be held on May 14, 2019. The Proxy Statement and Annual Report to Shareholders are available atwww.prudential.com/governance. | | | PAPER PRODUCED UNDER A SUSTAINABLE FOREST MANAGEMENT PROGRAM. | |  |
| | | | | | + |
IMPORTANT SHAREHOLDER INFORMATION YOUR VOTE COUNTS! | | | | | | | | | 
ANNUAL MEETING OF SHAREHOLDERS |  | | | | | | | May 14, 2019, 2:00 p.m. | | | | | 751 Broad Street, Newark, New Jersey 07102 | | | | | | | | You can vote and obtain proxy materials online. | | | | | | | | VOTING INSTRUCTIONS ARE LOCATED BELOW Dear Shareholder:
|
| | | | | | Shareholder Meeting Notice & Admission Ticket | | | |  |
Important Notice Regarding the Availability of Proxy Materials for the Prudential Financial, Inc. Shareholder Meeting to be Held on May 14, 2019 The proxy materials for the annual meeting are available online. The items to be voted on are listed below. Follow the instructions to view the materials and vote online.Your vote is important.To obtain a paper ore-mail copy of the proxy materials follow the instructions on the reverse side. Proposals to be voted on at the meeting are listed below along with the Board of Directors’ recommendations. The Board of Directors recommends that you voteFOR Proposals 1 – 3. | 1. | Election of Directors: Thomas J. Baltimore, Jr., Gilbert F. Casellas, Robert M. Falzon, Mark B. Grier, Martina Hund-Mejean, Karl J. Krapek, Peter R. Lighte, Charles F. Lowrey, George Paz, Sandra Pianalto, Christine A. Poon, Douglas A. Scovanner and Michael A. Todman. |
| 2. | Ratification of the appointment of PricewaterhouseCoopers LLP as our independent registered public accounting firm for 2019. |
| 3. | Advisory vote to approve named executive officer compensation. |
The Board of Directors recommends that you voteAGAINST Proposal 4: | 4. | Shareholder proposal regarding Right to Act by Written Consent. |
This communication presents only an overview of the more complete proxy materials that are available to you on the Internet. We encourage you to access and review all of the important information contained in the proxy materials before voting. The proxy statement and annual report to shareholders are available atwww.investorvote.com/prudential. | | | 
| | Easy Online Access — A Convenient Way to Vote! | | This package includes your proxy and voting materials. We care about whatIf you think and voting is an important way forhave access to the Internet, you to let us know how we’re doing.can complete the process in a few easy steps:
| | | Step 1: Go towww.investorvote.com/prudential | | | | | To express our appreciation when you vote, we are once again offering you a choiceStep 2: Click theViewbuttons to see the proxy statement, which contains details of receiving a specially designed, environmentally friendly tote bag, or contributingthe proposals to a tree-planting campaign. Since its inception, this program has resulted in over 730,000 trees being plantedbe voted on, and provided nearly 525,000 tote bags to our shareholders. This year’s tree-planting will continue our work with American Forests in our National Parks.the annual report.
| | | Step 3: Follow the instructions on the screen to log in. | | | | | Whether you vote via the Internet, phone, or mail, you can indicateStep 4: Make your choice of either the bag or a tree-planting contribution. If you electselection as instructed on each screen to receive a bag, you can expect to receive your free gift around the end of June.select delivery preferences.
| | | Step 5: Make your voting selections as instructed on the screen and click the vote button to submit your vote. |
PLEASE NOTE — YOU CANNOT VOTE BY RETURNING THIS NOTICE. To vote your shares, you must vote online or request a paper copy of the proxy materials to receive a proxy card. | | | | | | ∎ | | 2 N O T | | + | | | 02Z8LB Thank you,
| | | | | | |
Video Transcript Delivered For: Prudential Financial, Inc. 2019 Proxy Statement Douglas A. Scovanner, Prudential Financial, Inc. Board Member Margaret M. Foran, Chief Governance Officer, Senior Vice President, Corporate Secretary, Prudential Financial, Inc. Margaret Foran Hello. I am Margaret Foran, senior vice president, corporate secretary and chief governance officer at Prudential. Thank you for tuning in to watch this short video. Joining me is Doug Scovanner, Chairman of Prudential’s Audit Committee. Doug, thank you very much for taking time to share your insight about Prudential’s Board. Margaret Foran Can you tell me a bit about yourself? Douglas Scovanner After studying finance in graduate business school, I joined the Ford Motor Company. Over the following thirty-plus years, I held financial leadership positions at the Coca-Cola Company and Coca-Cola Enterprises, at the Fleming Companies, and finally at Target Corporation. I was Chief Financial Officer of Target for 18 years, as Target Stores grew to be a national retailer. Today, I am the Founder and Managing Member of Comprehensive Financial Strategies, a management consulting firm. I have been on the Prudential Board since 2013 and serve on several committees. Currently, I Chair the Audit Committee. Margaret Foran Can you tell me about the role of the Audit Committee and your role as Chair? Douglas Scovanner The primary purpose of the Audit Committee is to oversee the Company’s financial reporting and related internal controls, and to ensure that the Company’s auditor has the qualifications and independence necessary to perform the role successfully. In addition, the Audit Committee approves the report included in the Company’s annual proxy statement. As Chair, I oversee and take ultimate responsibility for the work of the Audit Committee. Margaret Foran Can you describe the Audit Committee’s financial reporting and related internal controls? Douglas Scovanner The oversight of financial reporting and related internal controls is key to our work. As an example, we engage with management continuously to provide actionable insights to improve financial practices and reporting. Margaret Foran How would you describe Prudential’s Board? Douglas Scovanner We are collaborative yet direct with each other. We work alongside the senior management team to define Prudential’s mission and actively oversee Prudential’s long-term strategy. If you look at our directors’ profiles, you will see that our skills, perspectives, and experiences are extremely diverse. This is a result of a deliberate strategy and our belief that a board with diverse views, perspectives, and backgrounds—a board that reflects our company and our customer base—is better equipped to guide Prudential forward. Margaret Foran You also sit on the Risk Committee. Can you tell me about the role of the Risk Committee? Douglas Scovanner Appreciating the value of risk oversight, we created a separate Risk Committee in 2016. The Committee oversees the governance of significant risks throughout the enterprise. We do this by coordinating the risk oversight functions of each Board committee and ensuring that matters are appropriately elevated to the Board. Margaret Foran How has the board changed since you joined? Douglas Scovanner Due to our commitment to succession planning and board refreshment, our average director tenure is about seven years. Since I joined five years ago, we have added four directors with extensive expertise in finance and capital allocation, Asian markets, and global corporate operations. Closing Douglas Scovanner I hope this gives our investors insight into our Board. I know I speak for the entire Board when I say that it is a privilege to serve as a director and that we are committed to achieving long-term performance and value for Prudential’s shareholders. Margaret Foran Thank you again for your time, Doug. Video Transcript Delivered For: Prudential Financial, Inc. 2019 Proxy Statement Thomas J. Baltimore, Prudential Financial, Inc. Lead Independent Director Theresa Molloy, Vice President, Prudential Financial, Inc. Theresa Molloy Hello. I am Theresa Molloy, vice president of corporate governance at Prudential. Thank you for tuning in to watch this short video. Joining me is Thomas Baltimore, Prudential’s Lead Independent Director. Tom, thank you very much for taking time to share your insight about Prudential’s Board. Theresa Molloy Tell me a little about your background. Thomas Baltimore I joined Prudential’s Board in May 2008. Professionally, I have spent nearly my entire career in the hospitality industry. Prior to my current role as chairman and CEO of Park Hotels & Resorts, I was president and CEO of RLJ Lodging Trust, which Ico-founded with Robert L. Johnson. Prior to RLJ, I was with Hilton Hotels. I started my hospitality career at Marriott. On a personal note, my wife Hillary and I are very involved in a local DC charity called N Street Village, a wonderful organization that empowers homeless andlow-income women to attain the highest quality of life by offering them a broad spectrum of services in an atmosphere of dignity and respect. Theresa Molloy Talk about your role as Lead Independent Director. Thomas Baltimore The Lead Independent Director is nominated by our independent peers for a term of one year but can serve up to three. At this year’s annual meeting, I will start my third and final term. Our Board gave careful thought to structuring the Lead Independent Director role. Important features include: The Lead Independent Director presides over all executive sessions where the chairman and CEO is not present. Prudential’s executive sessions are held at the beginning and end of every board meeting. The Lead Independent Director approves all Board agendas, meeting schedules, and information sent to the Board and; as the Lead Independent Director, I am available to meet with investors. Theresa Molloy What are the qualities that make Prudential’s Board unique? Thomas Baltimore I joined Prudential’s Board because I share many of the same values that are so important to the company, such as: A culture of integrity that cascades throughout the company’s global enterprise; a commitment to social responsibility, which is evident here in Newark and communities worldwide, and a commitment to creating products that enhance our ability to bring long-term financial security to our existing and prospective customers. Theresa Molloy You mentioned culture. How would you describe Prudential’s culture? Thomas Baltimore Our culture is one of our best assets. It is a competitive advantage and vital to the creation and protection of Prudential’s long-term value. We spend a great deal of time discussing culture at our board meetings. In addition, senior leaders and their teams present their business strategies to us throughout the year. This exchange of ideas gives directors insight into how employees throughout the organization are aligned with the business model and our values. Within this context, I would distill our culture down to our values, our practices and our people. Theresa Molloy Prudential has been lauded for its governance best practices. Describe some of these practices and why they are important to shareholders. Thomas Baltimore I will start with our Board structure 
| | | | | | 1. | Margaret M. ForanOur board is diverse in demographics and mindset. In fact, 80% of ournon- executive directors are diverse.
|
| | 2. | | | | Chief Governance Officer,Our annual Board evaluation is overseen by an independent third party. We take these results seriously and actively incorporate feedback into our processes and report the results in our proxy every year, and |
| | 3. | | | | Senior Vice PresidentOur corporate governance and Corporate Secretary | | | | | | Prudential Financial, Inc.business ethics committee has oversight of our company’s ethical, cultural, political and human rights practices. |
002CSN7BB6Next, our shareholder rights provisions
Prudential was the first company to proactively adopt proxy access We hold annual election of directors Our special meeting threshold is 10%, and We do not have a Poison Pill Theresa Molloy What is the Board’s view on talent management? Thomas Baltimore Talent management and succession planning are discussed at every board meeting. In September 2018, we announced a leadership transition that was the result of a rigorous, multi-year succession plan strategy. After much deliberation and exploration with a prominent search firm of possible external candidates, the Board reached a unanimous and confident decision to appoint Charlie Lowrey to the role of Chairman and CEO and to appoint Rob Falzon to the role of Vice Chairman. Rob and Charlie are outstanding executives with a long history of accomplishments at Prudential. Together they will continue to unlock the value in our strategic mix of high-quality businesses to put financial security within reach of our growing customer base. I hope this gives our investors perspective about our Board. I know I speak for the entire Board when I say that we are committed to working on behalf of our shareholders to achieve long-term performance and value for our company. Theresa Molloy– Thank you again for your time Tom. 3 |
| | | | | | | | |